Recharts
A composable charting library built on React components
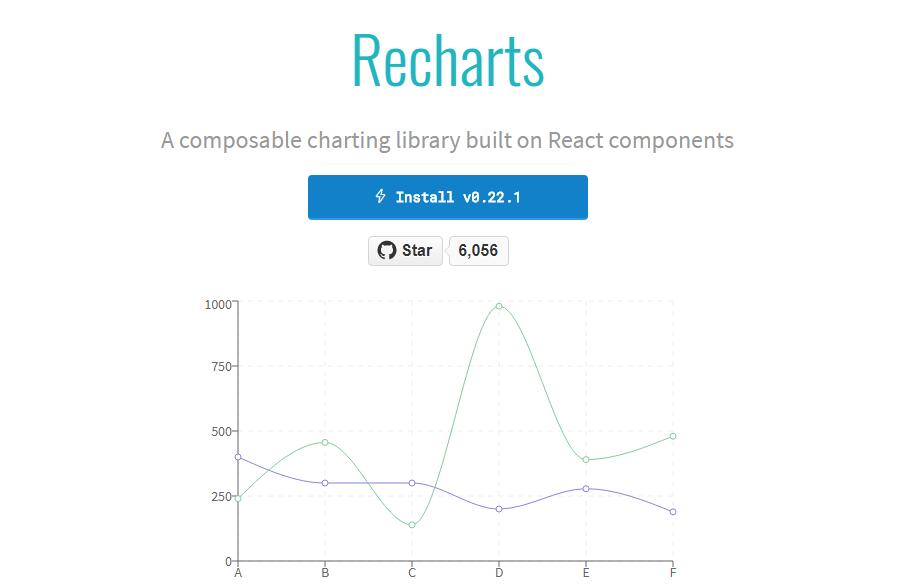
Recharts is a Redefined chart library built with React and D3.
The main purpose of this library is to help you to write charts in React applications without any pain. Main principles of Recharts are:
- Simply deploy with React components
- Native SVG support, lightweight depending only on some D3 submodules
- Declarative components, components of charts are purely presentational
Live demo
Examples
<LineChart
  width={400}
  height={400}
  data={data}
  margin={{ top: 5, right: 20, left: 10, bottom: 5 }}
>
  <XAxis dataKey="name" />
  <Tooltip />
  <CartesianGrid stroke="#f5f5f5" />
  <Line type="monotone" dataKey="uv" stroke="#ff7300" yAxisId={0} />
  <Line type="monotone" dataKey="pv" stroke="#387908" yAxisId={1} />
</LineChart>


