SQL Schema Visualizer
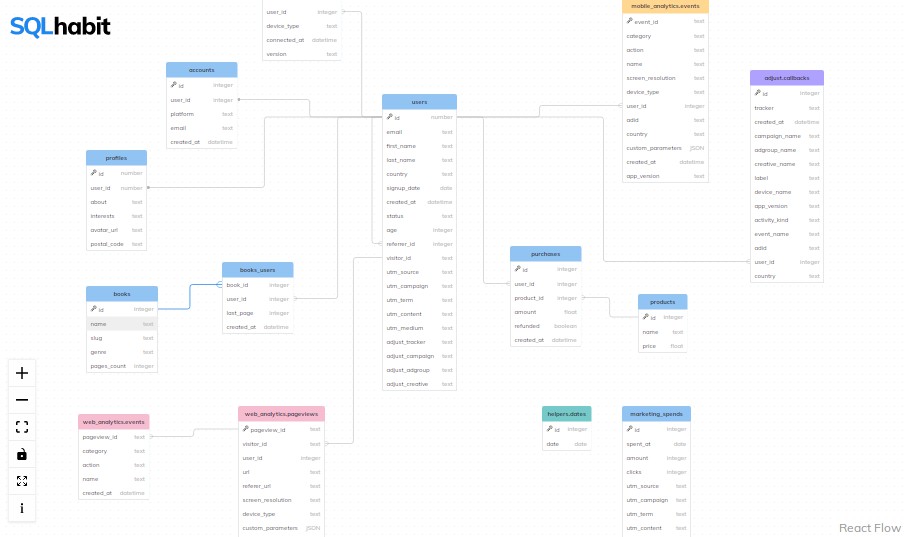
A prototype of relational database schema visualization using ReactFlow.
How it works?
Every table is a ReactFlow’ Custom Node with custom Markers (those SVG icons with dot and fork). Here’s a ReactFlow sandbox example of Custom Nodes.
How to update table positions?
- Drag them around to find a perfect arrangement.
- CMD + P (it copy pastes positions JSON to your clipboard).
- Paste the JSON to the
Flow/TablePositions.tsfile.
Installation
npm install
Start Dev Server
npm start
Runs the app in development mode. Open http://localhost:3000 to view it in the browser.
Run Tests
npm test
Build
npm run build
TODO
- Get rid of targetPosition param and set it on the fly based on relative node positions. https://reactflow.dev/docs/examples/nodes/update-node/
- Write README with screenshots and GIFs.
- Add contribution guide.
- Refactor.
- Add info popup content.
- Final colors for highlighted edges.
- Final style for table and column descriptions.
- Final colors for selected edges.
- Add info popup overlay.
- Style description tooltip.
- Write table descriptions.
- Fix mismatched column descriptions.
- Pull in all tables and their columns from Bindle dataset.
- Final font styles.
- Add Github Action to deploy to Github pages https://create-react-app.dev/docs/deployment/
- Colors for coding different schemas.
- CMD + Hover to show table and column descriptions.
- Disable node hover if CMD key is pressed (edge selection).
- Click on table name shows table description.
- Simple edge definition that’s translated later into ReactFlow syntax.
- CMD + P prints positions JSON to copy paste (sort tables alphabetically).
- Favicon.
- package.json info.
- Shoutout to ReactFlow demo app.
- Fix full screen icon when full screen is entered via a shortcut.
