vx
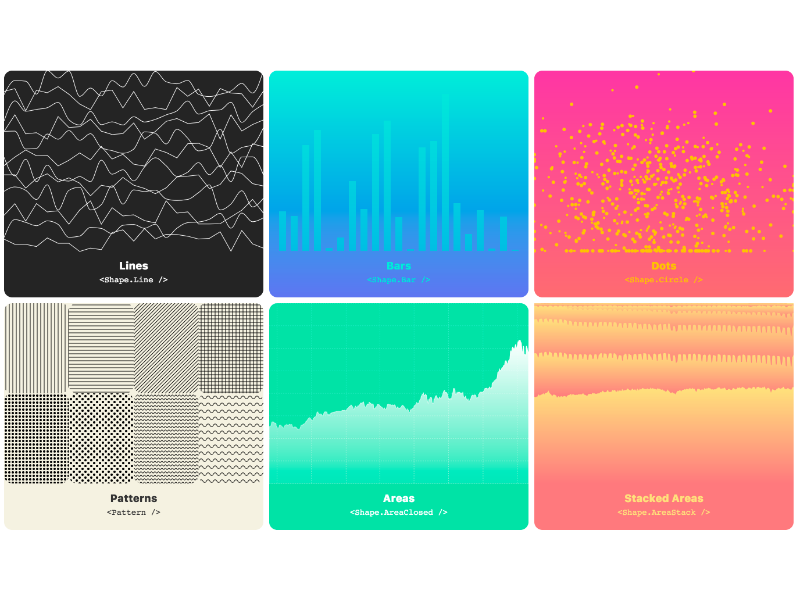
vx is a collection of reusable low-level visualization components. vx combines the power of d3 to generate your visualization with the benefits of react for updating the DOM.

Usage
Let's make a simple bar graph.
First we'll install the relevant packages:
$ npm install --save @vx/mock-data @vx/group @vx/shape @vx/scale

import React from 'react';
import { letterFrequency } from '@vx/mock-data';
import { Group } from '@vx/group';
import { Bar } from '@vx/shape';
import { scaleLinear, scaleBand } from '@vx/scale';

// We'll use some mock data from `@vx/mock-data` for this.
const data = letterFrequency;

// Define the graph dimensions and margins
const width = 500;
const height = 500;
const margin = { top: 20, bottom: 20, left: 20, right: 20 };

// Then we'll create some bounds
const xMax = width - margin.left - margin.right;
const yMax = height - margin.top - margin.bottom;

// We'll make some helpers to get at the data we want
const x = d => d.letter;
const y = d => +d.frequency * 100;

// And then scale the graph by our data
const xScale = scaleBand({
  rangeRound: [0, xMax],
  domain: data.map(x),
  padding: 0.4,
});
const yScale = scaleLinear({
  rangeRound: [yMax, 0],
  domain: [0, Math.max(...data.map(y))],
});

// Compose together the scale and accessor functions to get point functions
const compose = (scale, accessor) => (data) => scale(accessor(data));
const xPoint = compose(xScale, x);
const yPoint = compose(yScale, y);

// Finally we'll embed it all in an SVG
function BarGraph(props) {
  return (
    <svg width={width} height={height}>
      {data.map((d, i) => {
        const barHeight = yMax - yPoint(d);
        return (
          <Group key={`bar-${i}`}>
            <Bar
              x={xPoint(d)}
              y={yMax - barHeight}
              height={barHeight}
              width={xScale.bandwidth()}
              fill='#fc2e1c'
            />
          </Group>
        );
      })}
    </svg>
  );
}

// ... somewhere else, render it ...
// <BarGraph />
Goal
The goal is to create a library of components you can use to make both your own reusable chart library or your slick custom one-off chart. vx is largely unopinionated and is meant to be build on top of. Keep your bundle sizes down and use only the packages you need.
How?
Under the hood, vx is using d3 for the calculations and math. If you're creating your own awesome chart library ontop of vx, it's easy to create a component api that hides d3 entirely. Meaning your team could create charts as easily as using reusable react components.
But why?
Mixing two mental models for updating the DOM is never a good time. Copy and pasting d3 code into componentDidMount() is just that. This collection of components lets you easily build your own reusable visualization charts or library without having to learn d3. No more selections or enter()/exit()/update().