react-dynamic-charts
A React library for creating animated charts visualizations based on dynamic data.
Install
npm install --save react-dynamic-charts
Usage
import React, { Component } from 'react';

import { LiveBarChart } from 'react-dynamic-charts';
import 'react-dynamic-charts/dist/index.css'; // Don't forget to import the styles

class App extends Component {
  state = {
    data: [
      // ...
    ]
  };

  render () {
    return (
      <LiveBarChart
        data={this.state.data}
      />
    )
  }
}
Props
| Property | Type | Default | Description |
|---|---|---|---|
data |
array | [] | An array of objects that contain the data of the chart (see section below). |
baseline |
number | null | If you want the chart to have a baseline, add its number here. Could be useful for charts that include negative values. |
iterationTimeout |
number | 200 | Number of milliseconds you want between iterations. |
startAutomatically |
boolean | true | Whether the visualization should start running automatically. Default is true. |
startRunningTimeout |
number | 0 | Number of milliseconds you want before running the visualization. |
onRunStart |
function | null | A callback function that being called once the visualization starts. |
onRunEnd |
function | null | A callback function that being called once the visualization ends. |
showTitle |
boolean | true | Whether you want to show each iteration's title. |
barHeight |
number | 50 | The height (in pixels) of each bar item. |
showStartButton |
boolean | false | Show a start button that triggers the animation. |
startButtonText |
string | 'Start' | The text that will appear in the start button. |
mainWrapperStyles |
object | {} | Styles object for the component's main wrapper. |
chartWrapperStyles |
object | {} | Styles object for the chart wrapper. |
baselineStyles |
object | {} | Styles object for the baseline element. |
iterationTitleStyles |
object | {} | Styles object for the title element. |
labelStyles |
object | {} | Styles object for the chart's labels. |
startButtonStyles |
object | {} | Styles object for the start button. |
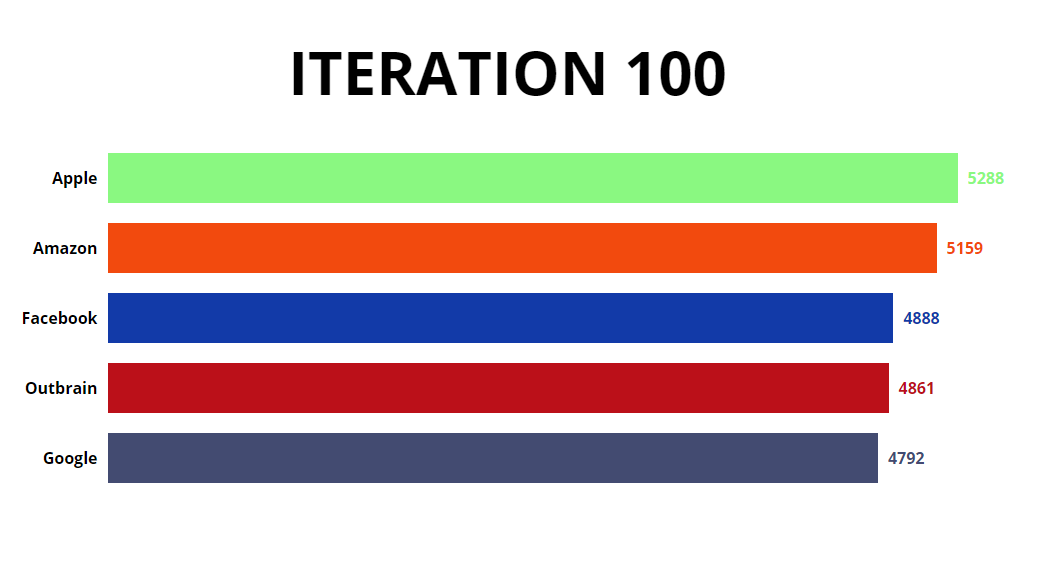
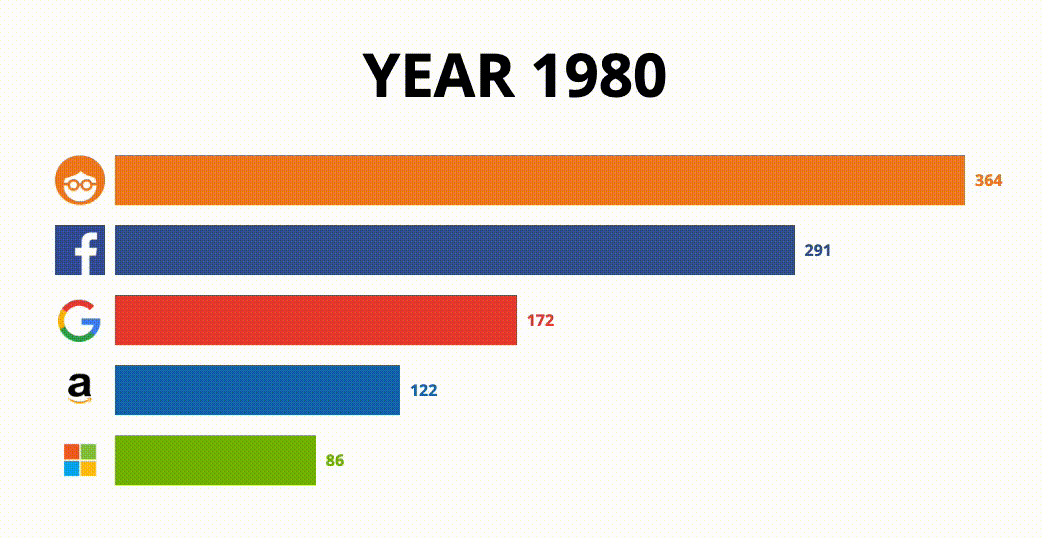
Data
The data property is expected to be an array of objects. Each object will present an iteration and will include the following fields:
| Property | Type | Description |
|---|---|---|
name |
string | The name of the iteration. |
values |
array | An array of data objects (see below). |
Each value in the values array will contain the following properties:
| Property | Type | Description |
|---|---|---|
id |
string / number | A unique identifier for the item. Note that it should be consistent across all iterations. |
label |
string / React Node | The label of the item. |
value |
number | A numeric value of the item. |
color |
string / array | Set a fixed color for the item. Could be also an array of colors that will generate a gradient effect. By default, if not set, each item will get a random color. |
Here's an example of a data object:
[
  {
    "name": "Round 1",
    "values": [
      {
        "id": 1,
        "label": "Test 1",
        "value": 0,
        "color": "red"
      },
      {
        "id": 2,
        "label": "Test 2",
        "value": 0,
        "color": ["yellow", "green"]
      }
    ]
  },
  {
    "name": "Round 2",
    "values": [
      {
        "id": 1,
        "label": "Test 1",
        "value": 10,
        "color": "red"
      },
      {
        "id": 2,
        "label": "Test 2",
        "value": 5,
        "color": ["yellow", "green"]
      }
    ]
  },
  {
    "name": "Round 3",
    "values": [
      {
        "id": 1,
        "label": "Test 1",
        "value": 12,
        "color": "red"
      },
      {
        "id": 2,
        "label": "Test 2",
        "value": 21,
        "color": ["yellow", "green"]
      }
    ]
  }
]