README
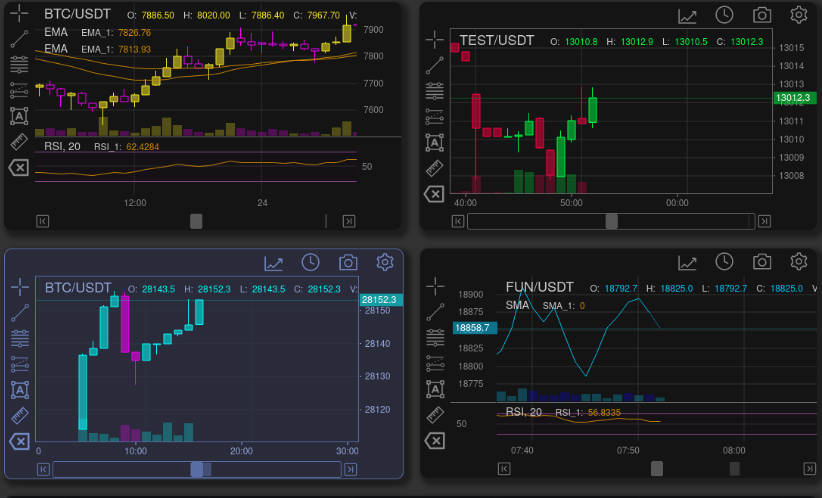
TradeX-chart is a highly customizable stock trade chart with one dependency written in plain JavaScript; use it with any framework or backend.

Demo
Live Demo
Requirements
TradeX-chart targets browsers that support ECMAScript 2022.
Install
NPM
npm install tradex-chart
In Browser
<script src="tradex-chart.es.js"></script>
How to Use
Minimal working example:
<div id="myChartDiv"></div>

<script>

import {Chart, DOM} from 'tradex-chart'
import * as talib from "talib-web"

// minimal data state
let state = {
  "ohlcv": [
// [timestamp, open, high, low, close, volume]
    [1543579200000,4035.6,4072.78348726,3965,4055.6,2157.50135341],
    [1543582800000,4055.6,4100,4035,4059.1719252,1660.6115119],
    [1543586400000,4059.1,4076.6,4014.1,4060,1070.09946267],
    [1543590000000,4060.5,4060.5,3987.2,4049.2,1530.46774287],
    [1543593600000,4049.2,4092.7,4035,4089.6691106,922.84509291]
  ]
}

// minimal config
const config = {
  id: "TradeX_test",
  title: "BTC/USDT",
  width: 1000,
  height: 800,
  utils: {none: true},
  tools: {none: true},
  talib: talib,
  // see configuration.md#config regarding talib.wasm
  // `${window.location.origin}/talib.wasm`
  rangeLimit: 30,
}

const mount = document.getElementById('myChartDiv')
const chart = document.createElement("tradex-chart")

mount.appendChild(chart)
chart.start(config)

</script>
Documentation
Documentation can be found here: Documentation
or built and run locally from the repository by running:
git clone https://github.com/tradex-app/TradeX-chart
cd ./tradex-chart/src/docs
npm run build
Editable Live Sandbox Examples
Editable sandbox examples can found on CodeSandbox.io
Framework Integration Examples
- Vue (TODO:)
- Svelte (TODO:)
Features
- Plain JavaScript with no framework dependencies
- All chart features and functions accessible via API
- State object defines chart configuration, indicators and tools
- State can be imported or exported for storage and retrieval
- Indicator calculation provided by talib-web as a WebAssembly module.
- Custom Themes
- Custom Indicators
- Custom Overlays
- Custom Drawing Tools (to be implemented)
- Event Hub – subscribe to chart events
- Rendering Optimization – smooth performance
- High frequency chart candles updates
- Export chart to png, jpg, webp, with optional watermarking
Support
For the latest news on TradeX-chart, feedback, feature requests, and community, join us over on Discord or GitHub.
Contributing
- Fork the Project
- Create your Feature Branch (git checkout -b feature/AmazingFeature)
- Commit your Changes (git commit -m ‘Add some AmazingFeature)
- Push to the Branch (git push origin feature/AmazingFeature)
- Open a Pull Request
Testing, bug reports and feature requests welcome
You can help speed up development by contributing with crypto or PayPal.
if (youEnjoyed) {
    starThisRepository();
}