recharts-to-png
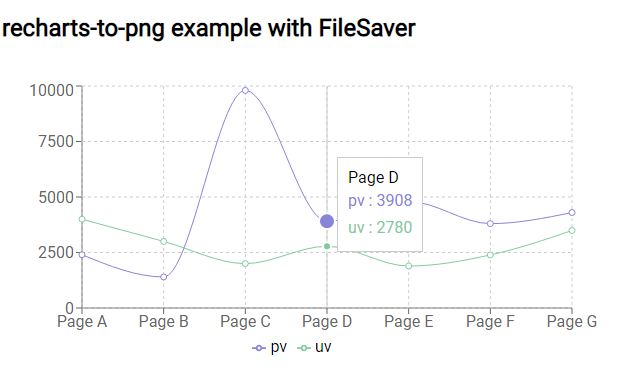
Uses html2canvas to convert a Recharts chart to PNG.
Inspired by these Stack Overflow questions and answers from peter.bartos and AlbertMunichMar.
Install
npm install recharts-to-png
Hook
The recommended way of using recharts-to-png. It is compatible with React 16.8+, does not rely on findDOMNode, and is required for React 17:
import { useRechartToPng } from "recharts-to-png";

function MyComponent() {
  // Attach ref to a Recharts component, and the png will be returned
  // Also accepts an optional argument for Html2Canvas options: useRechartToPng(options)
  const [png, ref] = useRechartToPng();

  const handleDownload = React.useCallback(async () => {
    FileSaver.saveAs(png, "myChart.png");
  }, [png]);

  return (
    <LineChart ref={ref} ... />
  )
}
Deprecated
The original getPngData function this library offered does not work with React 17 (see #6). This section is still included for backwards compatibility, but will probably be removed at some point along with getPngData.
Usage
// chart: Element | React.Component | AreaChart | BarChart | PieChart | etc.
await getPngData(chart);
Allows all html2canvas configuration options to be passed:
await getPngData(chart, options);
Example
function App() {
  // The chart that we want to download the PNG for.
  const [chart, setChart] = React.useState();

  const handleDownload = React.useCallback(async () => {
    if (chart !== undefined) {
      // Send the chart to getPngData
      const pngData = await getPngData(chart);
      // Use FileSaver to download the PNG
      FileSaver.saveAs(pngData, 'test.png');
    }
  }, [chart]);

  const data = [...];

  return (
    <>
      <LineChart
        ref={(ref) => setChart(ref)} // Set target element
        data={data}
        height={300}
        width={600}
      >
        <XAxis dataKey="name" />
        <YAxis />
        <CartesianGrid strokeDasharray="3 3" />
        <Tooltip />
        <Legend wrapperStyle={{ bottom: 0 }} />
        <Line type="monotone" dataKey="pv" stroke="#8884d8" activeDot={{ r: 8 }} />
        <Line type="monotone" dataKey="uv" stroke="#82ca9d" />
      </LineChart>
      <span style={{ float: 'left' }}>
        <button onClick={handleDownload}>Download</button>
      </span>
    </>
  );
}