REAVIZ
REAVIZ is a modular chart component library that leverages React natively for rendering the components while using D3js under the hood for calculations. The library provides an easy way to get started creating charts without sacrificing customization ability.

✨ Features
Chart types include:
- Bar Chart
- Line Chart
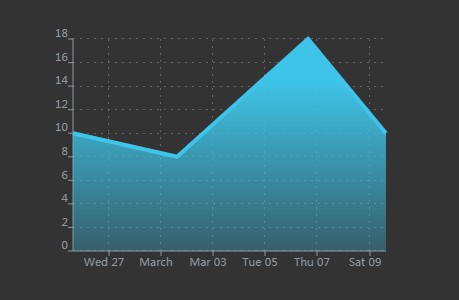
- Area Chart
- Pie Chart
- Bubble Chart
- Scatter Plot
- Hive Plot
- Sankey Chart
- Map Chart
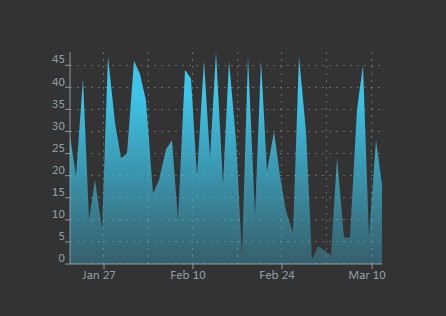
- Sparklines
Additional features:
- Legend
- Tooltips
- Animations Enter/Update/Exit
- Advanced Axis Configuration
- Brush
- Panning / Zooming
- Gestures
- Grid/Mark Lines
- BigInt Support
? Install
To use reaviz in your project, install it via npm/yarn:
npm i reaviz --save
then import a chart type into your JSX element:
import { BarChart } from "reaviz";

const data = [
  { key: 'IDS', data: 14 },
  { key: 'Malware', data: 5 },
  { key: 'DLP', data: 18 }
];

const App = () => <BarChart width={350} height={250} data={data} />;
Development
If you want to run REAVIZ locally, its super easy!
- Clone the repository
npm inpm start- Browser opens to Storybook page