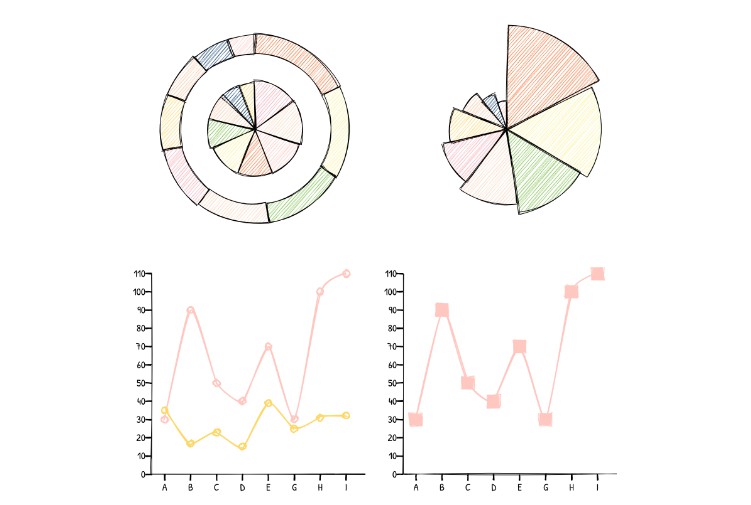
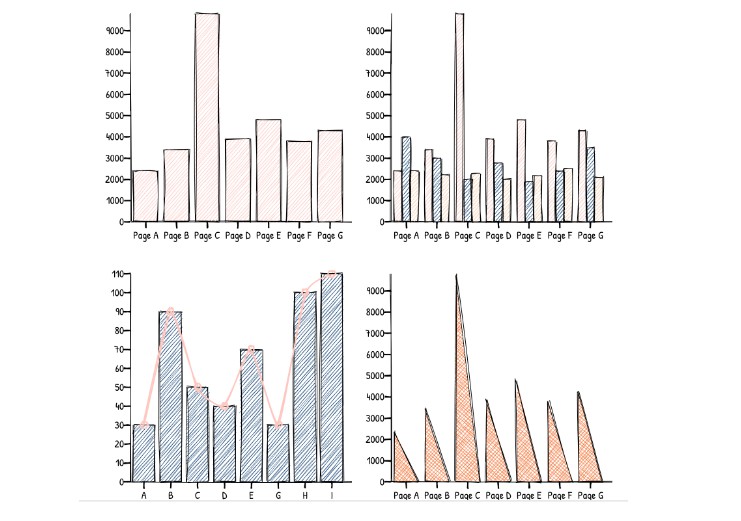
Rough Charts
A responsive, composable react charting library with a hand-drawn style.
Features
- It's responsive.
- It's flexible and easy to compose. You can compose all available ChartSeries Components and render any shapes you like.
- It's lovely.
- It's written in TypeScript.
Installation
yarn add rough-charts
This project contains a packaged called
react-roughjs. It has a lot of basic rough shapes, you may need it.
Usage
import * as React from 'react'
import {
  LineSeries, Tooltip,
  ChartProvider, XAxis, YAxis,
} from 'rough-charts'
import { colors } from './colors'

const data = [
  { name: 'A', value1: 30, value2: 35 },
  { name: 'B', value1: 90, value2: 17 },
  { name: 'C', value1: 50, value2: 23 },
  { name: 'D', value1: 40, value2: 15 },
  { name: 'E', value1: 70, value2: 39 },
  { name: 'G', value1: 30, value2: 25 },
  { name: 'H', value1: 100, value2: 31 },
  { name: 'I', value1: 110, value2: 32 },
]

const App = props => (
  <ChartProvider
    height={400}
    data={data}
  >
    <XAxis dataKey="name" />
    <YAxis />
    <LineSeries
      dataKey="value1"
      options={{
        stroke: colors[0],
        strokeWidth: 2,
      }}
    />
    <LineSeries
      dataKey="value2"
      options={{
        stroke: colors[3],
        strokeWidth: 2,
      }}
    />
    <Tooltip />
  </ChartProvider>
)
Fonts
Add your favorite hand-drawn style fonts:
<link href="https://fonts.googleapis.com/css?family=Patrick+Hand&display=swap" rel="stylesheet">
<style>
  * {
    font-family: 'Patrick Hand', cursive;
    font-size: 16px;
  }
</style>