
KlusterFunk is a monitoring tool, built to visualize metrics from local kafka clusters, showing you a real-time, live-updating graph of those metrics.
You can find and use our application at https://klusterfunk-b05ffb62bc07.herokuapp.com/
Overview
This is a tool meant for developers that are familiar with Kafka and how to export metrics. To use this tool we assume you have:
- Implemented Prometheus’ JMX exporter on your running Kafka cluster(s).
- Set up a Prometheus instance including a yaml config file that is pulling metrics from the port where JMX exporter metrics are being exposed.
- Port forward your Prometheus port so you can input the link in our app.
If you have not yet set up these tools for your clusters, follow the steps in Setup
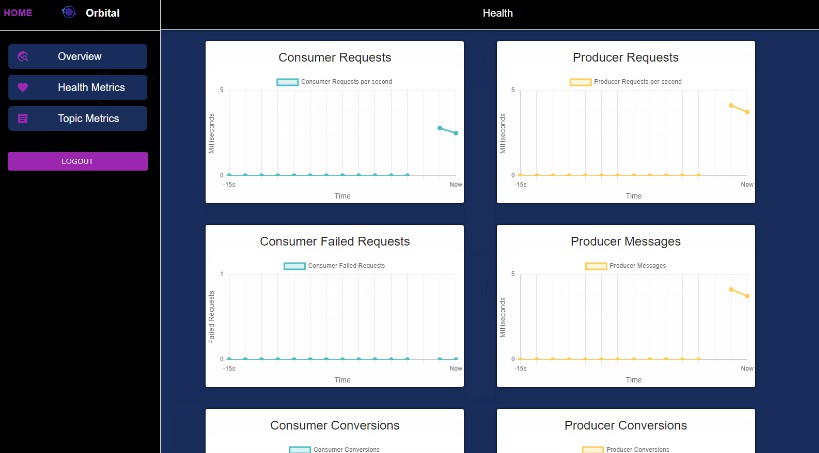
App in Action

Features
| Feature | Status |
|---|---|
| Login authorization using JWT tokens | ✅ |
| Prometheus API | ✅ |
| Build in functionality to have users simply input kafka cluster URIs and link up metrics on the backend | ⏳ |
| Allow users to choose from list of metrics they would like to see or even input metrics they want to see | ⏳ |
| Switch between Kafka clusters | ⏳ |
| Dark Mode | ⏳ |
| More styling using Tailwind | ?? |
| Save in database location of kafka clusters and prometheus address | ?? |
- ✅ = Ready to use
- ⏳ = In progress
- ?? = Looking for contributors
Setup
To setup JMX exporter
- Build exporter:
    git clone https://github.com/prometheus/jmx_exporter.git
    cd jmx_exporter
    mvn package
- Start zookeeper:
/usr/local/opt/kafka/bin/zookeeper-server-start /usr/local/etc/zookeeper/zoo.cfg
- Setup JMX exporter to run on Kafka (run from root) \
export EXTRA_ARGS="-Dcom.sun.management.jmxremote \
    -Dcom.sun.management.jmxremote.authenticate=false \
    -Dcom.sun.management.jmxremote.ssl=false \
    -Djava.util.logging.config.file=logging.properties \
    -javaagent:/Users/<username>/jmx_exporter/jmx_prometheus_javaagent/target/jmx_prometheus_javaagent-0.20.1-SNAPSHOT.jar=8081:/Users/<username>/jmx_exporter/example_configs/kafka-2_0_0.yml"
- Start kafka
/usr/local/opt/kafka/bin/kafka-server-start /usr/local/etc/kafka/server.properties
Localhost:8081 should now be displaying JMX metrics
- Run Prometheus and point it to scrape at port 8081 (or whatever port you configured the JMX exporter )
Contributing
Feel free to GitHub issues to let us know what features you want and what you’d like to see next from the project!
If you would like to work on the open source code, please do feel free to submit a pull request! Make sure you’re following Javascript ES6 syntax and modularize your code as much as possible.
To get started, first fork the repo to your personal github repos, then run the following commands:
git clone https://github.com/oslabs-beta/KlusterFunk.git
npm install
npm run dev
Stack
Apache Kafka, JMX Exporter, Prometheus, Node.js, Vite, MongoDB, Mongoose, Express, React, Chart.js, TailwindCSS, Vitest
Contact Us
Dominic Kenny – Github | LinkedIn
Connor Donahue – Github | LinkedIn
David Tezza – Github | LinkedIn