react-pdf-charts
Allows SVG-based React charts to be rendered in react-pdf.
Warning This library is in early development and may not be production ready. Please give it a try and provide your feedback in the issues.
Examples

Install
npm install react-pdf-charts
Usage
import ReactPDFChart from 'react-pdf-charts';
const data = [
{
name: 'Page A',
uv: 4000,
pv: 2400,
amt: 2400,
},
{
name: 'Page B',
uv: 3000,
pv: 1398,
amt: 2210,
},
{
name: 'Page C',
uv: 2000,
pv: 9800,
amt: 2290,
},
{
name: 'Page D',
uv: 2780,
pv: 3908,
amt: 2000,
},
{
name: 'Page E',
uv: 1890,
pv: 4800,
amt: 2181,
},
{
name: 'Page F',
uv: 2390,
pv: 3800,
amt: 2500,
},
{
name: 'Page G',
uv: 3490,
pv: 4300,
amt: 2100,
},
];
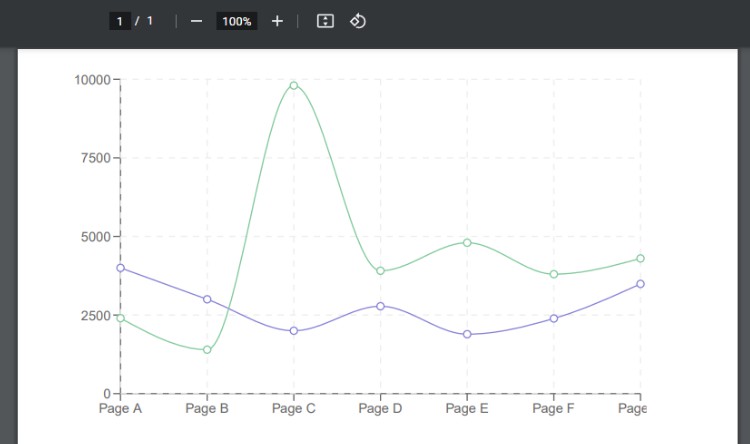
const SomeComponent = () => (
<ReactPDFChart>
<LineChart data={data} height={300} width={500}>
<XAxis dataKey='name' />
<YAxis />
<CartesianGrid stroke='#eee' strokeDasharray='5' />
<Line type='monotone' dataKey='uv' stroke='#8884d8' />
<Line type='monotone' dataKey='pv' stroke='#82ca9d' />
</LineChart>
</ReactPDFChart>
);
Examples
You can check the working examples in the /examples folder.
You can re-run the examples by downloading this repository, running bun install to install dependencies, and then running bun start to re-generate the .pdf files in the examples folder.