d3 wrapper for casual data visualization
Status
v0.1.0 (alpha release), the npm package is available.
The static bundle file is not supplied at now. If you want to get a prebuilt static script as sdatch.js, copy it from dist directory or bundle it on your machine (follow the procedure on here).
Features
- Simple Layer constructors (e.g. Bar, Plot, Line, etc.) which needs single config object as the argument.
- Easy layer generation with sdatch class and related functions such as
createFigureandaddLayer. - Additional layer operation via method chain syntax, such as
obj.setLabel().setTransition().
See also our design concept.
Download and Install
cd path/to/project
npm install sdatch
HowTos
- Use sdatch Bar constructor on static HTML
<html lang="en">
<head>
    <meta charset="UTF-8"/>
    <title>sample</title></head>
<body>
<div id="sample-fig"></div>
</body>
<script type="text/javascript" src="sdatch.js"></script>
<script type="text/javascript">
    const data = [4, 5, 5, 4, 5], width = 300, height = 200
    let myAzukiBar = new sdatch.Bar({
        id: "layer1",
        data: data,
        area: {x: 200, y: 180},
        axe: {y: true},
        svg: {
            target: "sample-fig",
            width: width,
            height: height,
        },
        label: true,
        color: {fill: "#d66"}
    }).render()
</script>
</html>
- same as previous one, but use addLayer
<html lang="en">
<head>
    <meta charset="UTF-8"/>
    <title>sample</title></head>
<body>
<div id="sample-fig"></div>
</body>
<script type="text/javascript" src="sdatch.js"></script>
<script type="text/javascript">
    const data = [1, 2, 3, 4, 5], width = 411, height = 200
    let fig = sdatch.createFigure("sample-fig", width, height)
    fig.addLayer({
        id: "layer2", type: "bar",
        data: data, axe: {y: true}, label: true,
        area: {x: 250, y: 180},
        color: {textBackground: "gray"}
    })

</script>
</html>
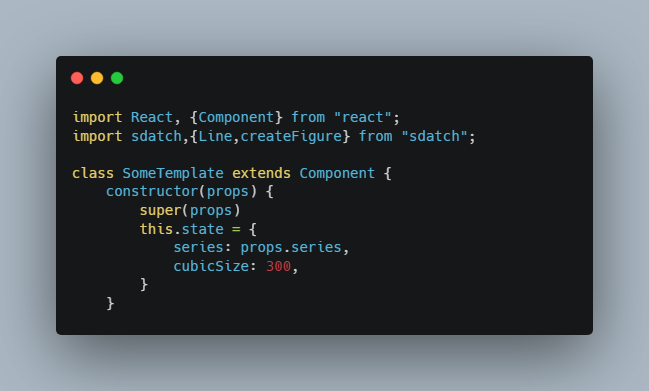
- Embed sdatch into React App
import React, {Component} from "react";
import sdatch,{Line,createFigure} from "sdatch";

class SomeTemplate extends Component {
    constructor(props) {
        super(props)
        this.state = {
            series: props.series,
            cubicSize: 300,
        }
    }
    componentDidMount(){
        let s = createFigure('fig-' + this.state.series, this.state.cubicSize, this.state.cubicSize),
            column = [1,2,3,5,8],
            data = [2.83,2.15,3.21,3.13,3.35],
            comp = [3,3,3,3,3]

        s.addLayer([{
            id: this.state.series , type: "line",
            column: column, data: data,
            color: { fill: "#f03589" }, label: true
        },{
            id: this.state.series + "-comparative", type: "line",
            column: column, data: comp,
            color: { fill: "#35f089" }, label: true,
            hasPlot: false
        }]).renderAll()
    }

    render() {
        return (
            <div className="card col-12 mb-2 bg-dark">
                <div id={'fig-' + this.state.series}></div>
            </div>
        )
    }
}

export default SomeTemplate
Core concept
Nowadays, there are many wrappers for d3 and there are many visualization solutions using d3.
In many conditions, they support much more use cases than we think.
It seems to be enough to use existing FLOSS wrapper library or SaaS which visualize our data, for business or personal.
We, sdatch developers, recognize two core values of the project, CASUALTY and CONTEXT-ORIENTED visualization.
Casualty
- easy to use, for everyone including designers or non-frontend developers, even for beginners.
- easy to embed or bundle, supporting ES6+
importand React / Vue3 integration. - easy to understand, built on top of ES6+ class abstraction with object-oriented layer model.
Context-oriented (or developer-friendly)
- Any chart is also a context itself. sdatch should enable user to select the most beneficial context for specific use cases, specifying various rendering effects (e.g. color, positioning, font-family, padding, etc.).
- Using sdatch’s FigConfig object, users take powers to make a figure within a few lines, and a few works to implement it. You can make more time to think about the data.
- Built-in fail-safe rendering (FSR) supports you to render objects with few manual position adjustment. Always make it pretty, for coworkers, designers and for end users.
Develop
Environment
- VSCode or WebStorm are recommended for editors.
npm run bundleto make new bundle indistdir.- run
./replace_nyc.shbeforenpm run test. It replaces native coverage tool from nyc to c8. (dirty hack)
Testing on Containers
docker-compose is useful to check e2e behavior of bundled script.
docker-compose up -d
your-browser http://localhost:8080/demo.html
Miscellaneous
browser support
For this small project, that’s so meaningless to support legacy browsers like IE9 or IE10 or IE11 or… Thus, we drop support for these browsers.
The optimized script is put under dist directory, and it is built and bundled with webpack5 + babel-loader.
All UMD compatible stacks (V8, Spidermonkey, etc.) are supported with babel-loader (based on babel-7.14.x).
If you know there is corrupted behavior for the library on any browsers and if you think it should work, please make issues, thanks.
Known problems
Many. Please wait for days to report all known issues.
Contact
make issues or PR, thanks.
Special Thanks
D3 is excellent library by Mike Bostock. This library is perfectly depends on his works. Thanks a lot Mr. Bostock and D3 contributors!!
D3 and its module is licensed under ISC. If you use this library, please include both of D3’s ISC license and the license of this project.
If you copy and redistribute bundled library in dist, don’t forget also to copy its license.