React Timeseries Charts
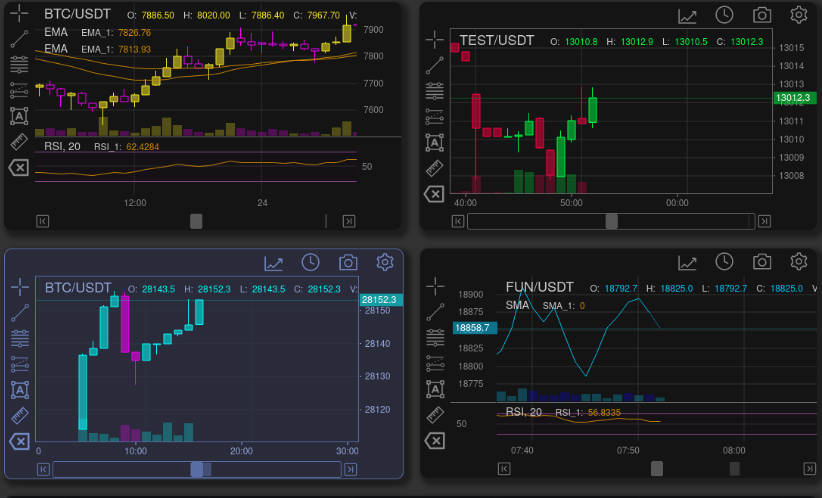
This library contains a set of modular charting components used for building flexible interactive charts. It was built for React from the ground up, specifically to visualize timeseries data and network traffic data in particular. Low level elements are constructed using d3, while higher level composability is provided by React. Charts can be stacked as rows, overlaid on top of each other, or any combination, all in a highly declarative manner.
The library is used throughout the public facing ESnet Portal.
Current features of the library include:
Declarative layout of charts using JSX
Interactivity, including pan and zoom
Add new chart types or overlays
Multiple axis, multiple rows
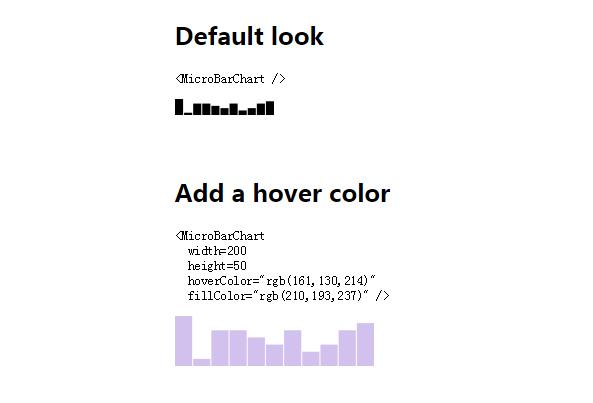
Line, area, scatter, bar and boxplot charts
Brushing
Legends
Overlay markers
Live Demo
http://software.es.net/react-timeseries-charts