redux-devtools-filterable-log-monitor
Filterable tree view monitor for Redux DevTools.
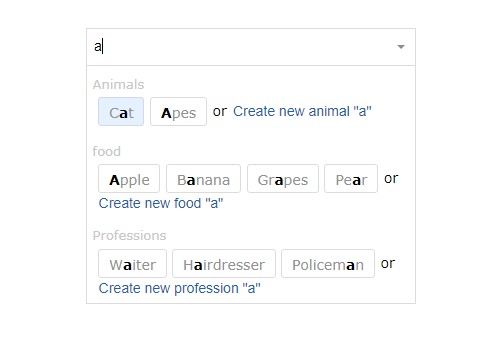
Actions are collapsed by default but they can be expanded by clicking on the action type. Strings and regular expressions can be used to filter actions by type as well as to filter the state tree by nodes or values.
Installation
npm install --save-dev redux-devtools-filterable-log-monitor
Usage
The FilterableLogMonitor is intended for use within the DockMonitor. You can configure your app to use these monitors like so:
import React from 'react'
import { createDevTools } from 'redux-devtools'
import DockMonitor from 'redux-devtools-dock-monitor'
import FilterableLogMonitor from '../src'

const DevTools = createDevTools(
  <DockMonitor toggleVisibilityKey='ctrl-h'
               changePositionKey='ctrl-q'>
    <FilterableLogMonitor/>
  </DockMonitor>
)

export default DevTools
Then you can render <DevTools> to any place inside app or even into a separate popup window.
Read how to start using Redux DevTools.
Features
Every action is displayed in the log. Use the filter input to quickly and easily locate nodes in your store that are deeply nested. You can search using regular expressions or simple strings. Select whether the search should match keys, values, or either using the checkboxes above the filter input.