react-jsx-highcharts
A project for integrating Highcharts into a React app, with proper React components for each Highcharts/Highstock component. Inspired by Recharts, but for Highcharts, obviously.
As of 1.2.0 React JSX Highcharts supports using Immutable.js data structures as Series data.
As of 1.3.0 React JSX Highcharts supports 3D charts.
As of 2.1.0 Highcharts 6 is supported
As of 2.x you are required to use the withHighcharts HOC to inject the Highcharts object (see below)
Upgrading from 1.x to 2.x
React JSX Highcharts now requires the withHighcharts higher order component to render your chart components. This HOC allows you to inject the Highcharts object the library will interact with.
This means we can use Highcharts in styled mode (style by CSS) - see example, or perform customisations to the Highcharts object before using it.
Using 1.x your code would have looked something like
import { HighchartsChart, Chart, /* etc... */ } from 'react-jsx-highcharts';
import Highcharts from 'highcharts';

const MyChart = () => (
  <HighchartsChart>
    <Chart />
    // etc
  </HighchartsChart>
);

export default MyChart
But with 2.x you need to use withHighcharts, when exporting the component (note the last line)
import { withHighcharts, HighchartsChart, Chart, /* etc... */ } from 'react-jsx-highcharts';
import Highcharts from 'highcharts';

const MyChart = () => (
  <HighchartsChart>
    <Chart />
    // etc
  </HighchartsChart>
);

export default withHighcharts(MyChart, Highcharts); // Injecting the Highcharts object
Example
render () {
return (
<HighchartsChart>
<Chart />
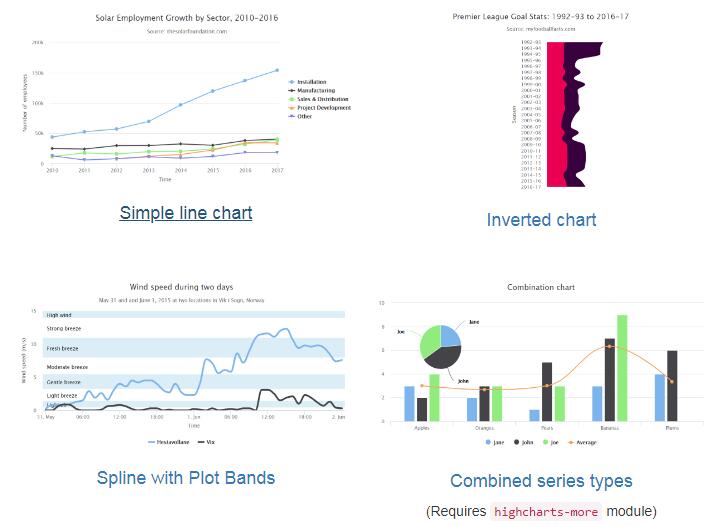
<Title>Solar Employment Growth by Sector, 2010-2016</Title>
<Subtitle>Source: thesolarfoundation.com</Subtitle>
<Legend layout="vertical" align="right" verticalAlign="middle" />
<XAxis>
<XAxis.Title>Time</XAxis.Title>
</XAxis>
<YAxis id="number">
<YAxis.Title>Number of employees</YAxis.Title>
<LineSeries id="installation" name="Installation" data={[43934, 52503, 57177, 69658, 97031, 119931, 137133, 154175]} />
<LineSeries id="manufacturing" name="Manufacturing" data={[24916, 24064, 29742, 29851, 32490, 30282, 38121, 40434]} />
<LineSeries id="sales-distribution" name="Sales & Distribution" data={[11744, 17722, 16005, 19771, 20185, 24377, 32147, 39387]} />
<LineSeries id="project-development" name="Project Development" data={[null, null, 7988, 12169, 15112, 22452, 34400, 34227]} />
<LineSeries id="other" name="Other" data={[12908, 5948, 8105, 11248, 8989, 11816, 18274, 18111]} />
</YAxis>
</HighchartsChart>
);
}
// Provide Highcharts object for library to interact with
export default withHighcharts(MyComponent, Highcharts);
Getting Started
Highcharts
npm install --save react-jsx-highcharts
You'll need the peer dependencies too
npm install --save react react-dom prop-types highcharts@^5.0.0
Highstock (also includes Highcharts)
npm install --save react-jsx-highstock
You'll need the peer dependencies too
npm install --save react react-dom prop-types highcharts@^5.0.0
Note: import Highcharts with import Highcharts from 'highcharts/highstock'
Upcoming Features
<Highcharts3dChart>component - A helper for 3D charts.React 16 support - all features seem to work with beta 3, just need to modifyDone! 1.4.0peerDependenciesand await Enzyme support for React 16- Use
React.PureComponentinstead ofComponent Highcharts 6.0 supportDone 2.1.0- Use new context API due to be added in React 16.3
Goals
This project aims to hide the complexity of Highcharts from the React application author, allowing the rendering of charts in a React familiar way.
It also aims to use best React and Highcharts practices where possible - for example if the data prop of a Series were to change React JSX Highcharts uses the Series.prototype.setData method of Highcharts which is much less expensive than update.
Additionally we avoid passing large JSON configuration objects as props, as this leads to painful debugging when trying to work out why your component did or did not re-render, this also helps as an abstraction over the complexity as mentioned above.
Technical approach
Rather than passing around a chart object between all the components, we utilise React's context to share the chart object around, then using Higher Order Components (HOCs), we inject the Highcharts functions we need to the wrapped component.
There are 3 HOCs in this project, provideChart, provideAxis and provideSeries.
In the vast majority of cases, there is no need to use these HOCs directly - but they have been exposed anyway - they are useful if you want to create your own components with this library.
Common issues
Uncaught TypeError: Cannot read property 'chart' of undefined
You need to use the withHighcharts higher order component to inject the Highcharts object. See here
Uncaught TypeError: Cannot read property 'stockChart' of undefined
As above, or you are importing Highcharts rather than Highstock. Change you Highcharts import to...
import Highcharts from 'highcharts/highstock';
Highcharts error #17
You likely need to add an extra Highcharts module to support the requested series type, this is usually Highcharts more.
import Highcharts from 'highcharts';
import addHighchartsMore from 'highcharts/highcharts-more';

addHighchartsMore(Highcharts);
Alternatively it may be the Heatmap, Treemap, Sankey, or one of these extra modules.
import Highcharts from 'highcharts';
import addHeatmapModule from 'highcharts/modules/heatmap';
import addTreemapModule from 'highcharts/modules/treemap';

addHeatmapModule(Highcharts);
addTreemapModule(Highcharts);