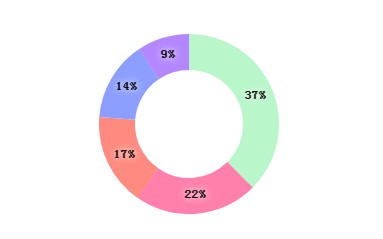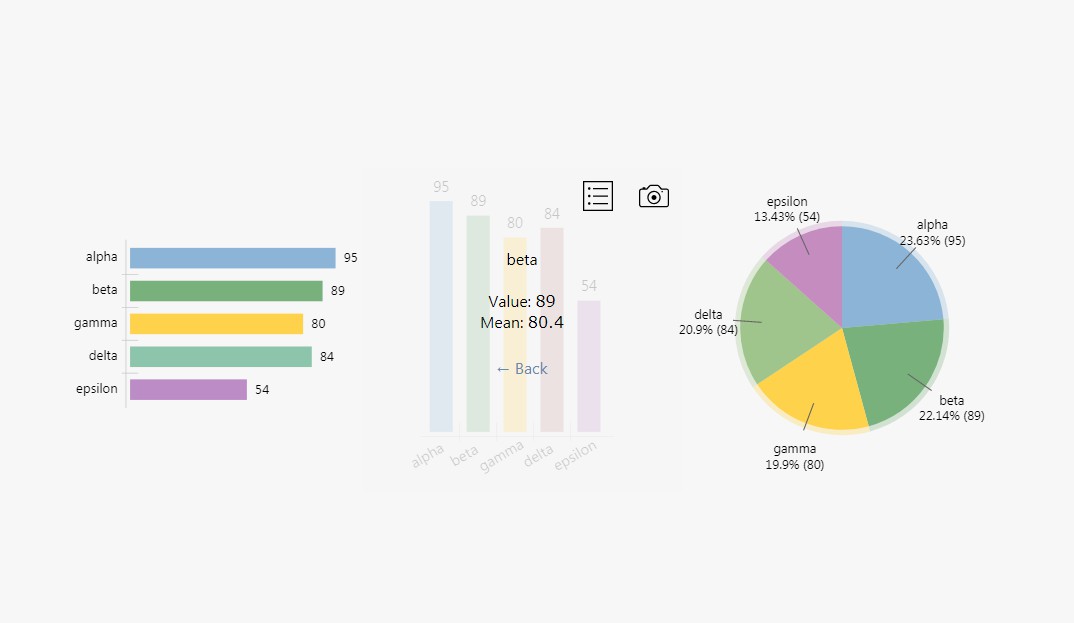
React minimal pie chart
Lightweight React SVG pie charts, with versatile options and CSS animation included.
Installation
npm install react-minimal-pie-chart
If you don't use a package manager, react-minimal-pie-chart exposes also an ÙMD module ready for the browser.
https://unpkg.com/react-minimal-pie-chart/umd/index.js
Why?
Because Recharts is awesome, but when you just need a simple pie/donought chart, a few lines of code are usually enough.
Features
- No dependencies (except for React's prop-types)
- Customizable CSS animations with stroke-dasharray + stroke-dashoffset strategy
- Configurable: Pie, Donut, Loading, Completion charts (see [Demo][storybook])
Options
| Property | Type | Description | Default |
|---|---|---|---|
| data (required) | Array | The source data which each element is a segment. | - |
| cx | Number | The x-coordinate of center. The value is the percentage of the component width | 50 |
| cy | Number | The y-coordinate of center. The value is the percentage of the component height | 50 |
| ratio | Number | The ratio of rendered svg element | 1 |
| startAngle | Number | The start angle of first sector | 0 |
| lengthAngle | Number | The total angle taken by the chart (can be negative to make the chart clockwise!) | 360 |
| totalValue | Number | The total value represented by the full chart | - |
| lineWidth | Number | The width of the line representing each sector. The value is the percentage of chart radio (100 === full pie) | 100 |
| radius | Number | The radius of the pie. The value is the percentage of the component width * | 50 |
| paddingAngle | Number | The angle between two sectors | - |
| rounded | Bool | Round line caps of each sector | false |
| segmentsStyle | Object | Style object assigned each segments | - |
| animate | Bool | Animate sectors on component mount | false |
| animationDuration | Number | Animation duration in ms | 500 |
| animationEasing | String | Animation CSS easing | "ease-out" |
| reveal | Number | Turn on CSS animation and reveal just a percentage of each segment | - |
| onClick | Function | Custom event handler of onClick on each sector : (event, data, dataIndex) => {} |
- |
| onMouseOver | Function | Custom event handler of onMouseOver on each sector : (event, data, dataIndex) => {} |
- |
| onMouseOut | Function | Custom event handler of onMouseOut on each sector : (event, data, dataIndex) => {} |
- |
Each data entry can also accept an optional key property just in case items' indexes weren't enough:
{ value: 10, key: 1, color: '#E38627' }
How to
User interactions with the chart
See [demo][demo-interaction] and its [source][demo-interaction-source].
Browsers support
The main requirement of this library is an accurate rendering of SVG Stroke properties.
Not supported
- IE ≤ 10
Partially supported
- IE 11
Misc
How svg arc paths work?
http://users.ecs.soton.ac.uk/rfp07r/interactive-svg-examples/
Todo's
- Find a better
paddingAngleimplementation - Make a device/browser compatibility table
- Background segment