react-bubble-chart-d3
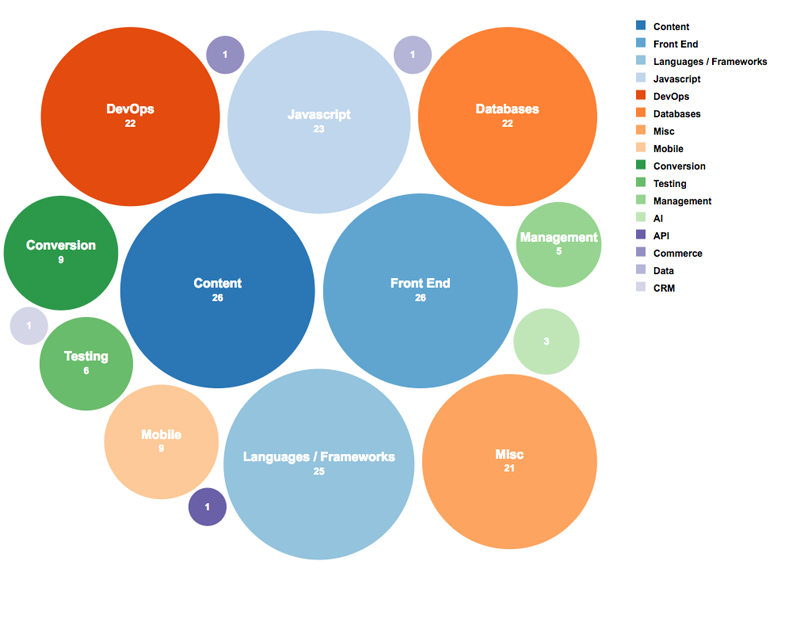
ReactJS component to display data as a bubble chart using d3.
General Usage
As you will be able to see in test in order to use the component we need to importe it as:
import BubbleChart from '@weknow/react-bubble-chart-d3';
Then, in the render method we can just call it like:
bubbleClick = (label) =>{
  console.log("Custom bubble click func")
}
legendClick = (label) =>{
  console.log("Customer legend click func")
}
<BubbleChart
  graph= {
    zoom: 1.1,
    offsetX: -0.05,
    offsetY: -0.01,
  }
  width={1000}
  height={800}
  showLegend={true} // optional value, pass false to disable the legend.
  legendPercentage={20} // number that represent the % of with that legend going to use.
  legendFont={{
        family: 'Arial',
        size: 12,
        color: '#000',
        weight: 'bold',
      }}
  valueFont={{
        family: 'Arial',
        size: 12,
        color: '#fff',
        weight: 'bold',
      }}
  labelFont={{
        family: 'Arial',
        size: 16,
        color: '#fff',
        weight: 'bold',
      }}
  //Custom bubble/legend click functions such as searching using the label, redirecting to other page
  bubbleClickFunc={this.bubbleClick}
  legendClickFun={this.legendClick}
  data={[
    { label: 'CRM', value: 1 },
    { label: 'API', value: 1 },
    { label: 'Data', value: 1 },
    { label: 'Commerce', value: 1 },
    { label: 'AI', value: 3 },
    { label: 'Management', value: 5 },
    { label: 'Testing', value: 6 },
    { label: 'Mobile', value: 9 },
    { label: 'Conversion', value: 9 },
    { label: 'Misc', value: 21 },
    { label: 'Databases', value: 22 },
    { label: 'DevOps', value: 22 },
    { label: 'Javascript', value: 23 },
    { label: 'Languages / Frameworks', value: 25 },
    { label: 'Front End', value: 26 },
    { label: 'Content', value: 26 },
  ]}
/>
The data prop receive and array of objects:
{
  label: 'label', // Text to display.
  value: 1, // Numeric Value.
  /**
    Color of the circle this value it's optional,
    accept hex (#ff0000) and string (red) name values.
    If you don't provide a value the default behavior
    is assign a color based on a d3.schemeCategory20c
    color schema.
  */
  color: '#ff00ff',
}
The graph prop receive a configuration object to set the zoom and offset of the bubbles:
graph: {
  zoom: 1.1, // 1.1 means 110% of zoom.
  offsetX: -0.05, // -0.05 means that the offset is -5% of the graph width.
  offsetY: -0.01,
}
The legendFont, valueFont and labelFont prop receive a configuration object to set the font-family, font-size, font-weight and color of the text:
// If you don't set this prop the default configuration will be this object.
{
  family: 'Arial',
  size: 12,
  color: '#000',
  weight: 'bold',
  // lineColor and lineWeight are optionals. use only to add a border line to the text.
  lineColor: "#3f3f3f",
  lineWeight: 2,
}
Installation
Install this component is easy, just use npm as:
npm install @weknow/react-bubble-chart-d3