React Trend
Graphing tools are often complex, abstract, and heavy. They require domain-specific knowledge, and a significant time investment.
While building rich data visualizations for an analytics app, this is a necessary cost. But what if you just need a spark line that shows a trend?
For example, here's how GitHub shows activity on a repo:
Here's how Twitter displays your recent analytics:

These are very simple and elegant visualizations, and they should not require a bloated graphing library to produce.
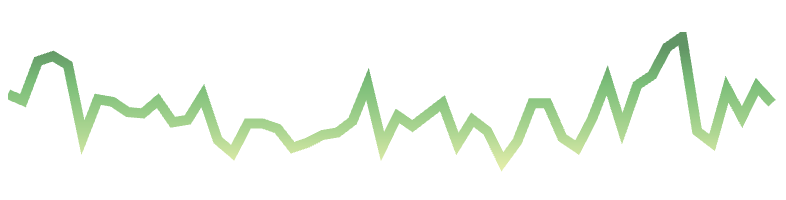
React Trend is a concrete component that does 1 thing, and does it well: generate these trending graphs.
Live Demo
https://unsplash.github.io/react-trend/