![]()
PerfSSR
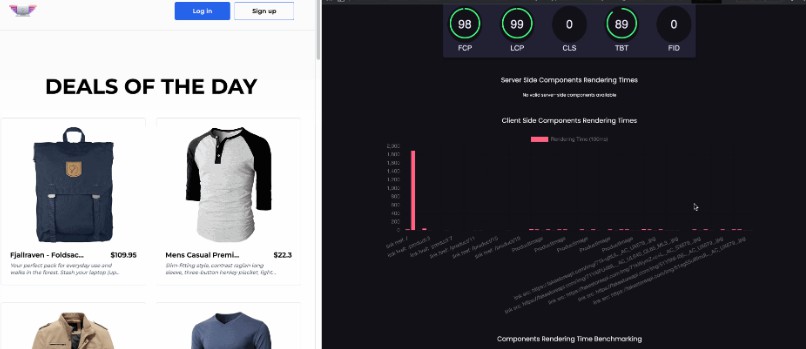
PerfSSR is an open-source Chrome Developer Tool that enhances performance and observability for Next.js applications. It offers real-time performance analytics, providing valuable and comprehensive insights into various aspects of the application.

Tech Stack
Motivation
Fetches made server-side get logged in your terminal not the browser. PerfSSR Dev Tool solves this by showing server-side fetch requests in browser alongside the Chrome Network tab.
Next.js already instruments using OpenTelemetry for us out of the box so we can just access their built-in spans.
Credit to NetPulse for this idea.


Setup
Prerequisites
-
Ensure you have React Dev Tools installed
-
In your project directory
npm install perfssr --save-dev -
Install our PerfSSR Chrome Extension
-
As of the current Next.js version [13.4.4], instrumentation is an experimental hook so it must be included in the
next.config.jsfile. Add the following code to your next config object.experimental: { instrumentationHook: true }
-
Create a file in your project root directory called
instrumentation.ts. This file will be loaded when Next.js dev server runs and sees that instrumentation is enabled. Within this file we need to import a file that we’ll be creating in the next step that starts tracing the Next.js applicationexport async function register() { //OpenTelemetry APIs are not compatible with edge runtime //need to only import when our runtime is nodejs if (process.env.NEXT_RUNTIME === "nodejs") { //Import the script that will start tracing the Next.js application //In our case it is perfssr.ts //Change it to your own file name if you named it something else await import("./perfssr"); } }
-
Create another file [.ts or .js] to your project root directory this can be named anything you’d like. We have ours called
perfssr.ts- Inside
perfssr.tscopy and paste this block of code
import { NodeSDK } from "@opentelemetry/sdk-node";
import { OTLPTraceExporter } from "@opentelemetry/exporter-trace-otlp-http";
import { Resource } from "@opentelemetry/resources";
import { SemanticResourceAttributes } from "@opentelemetry/semantic-conventions";
import { SimpleSpanProcessor } from "@opentelemetry/sdk-trace-node";

const sdk = new NodeSDK({
  resource: new Resource({
    [SemanticResourceAttributes.SERVICE_NAME]: "next-app",
  }),

  spanProcessor: new SimpleSpanProcessor(
    new OTLPTraceExporter({
      //all traces exported to express server on port 4000
      url: `http://localhost:4000`,
    })
  ),
});

sdk.start();
- You will need to add all these OpenTelemetry modules as dependencies to your
package.json
npm i --save-dev @opentelemetry/exporter-trace-otlp-http @opentelemetry/resources @opentelemetry/sdk-node @opentelemetry/sdk-trace-node @opentelemetry/semantic-conventions
- Inside
-
Create a
.envfile in the root of your project directory. By default Next.js only creates spans for the API routes, but we want more information than that! To open it up, Next.js looks for a value set inprocess.envAdd the lineNEXT_OTEL_VERBOSE=1to your.envfile. -
Include another script line to your
package.jsonfile
"perfssr": "node ./node_modules/perfssr/server.js & next dev"
- Run PerfSSR by running the command
npm run perfssrwithin your terminal.
Chrome Extension Installation
- Clone the PerfSSR repo onto your local machine
git clone https://github.com/oslabs-beta/perfSSR.git
- Install dependencies and build the PerfSSR application locally
npm install
npm run build
- Add PerfSSR to your Chrome extensions
- Navigate to chrome://extensions
- Select Load Unpacked
- Turn on ‘Allow access to file URLs’ in extension details
- Choose PerfSSR/dist
- Navigate to your application in development mode
- Open up your project in Google Chrome
- Navigate to the PerfSSR panel. Click on the Start PerfSSR button will automatically refreshes the page and starts the extraction of performance data of the currently inspected webpage
- Click on Regenerate Metrics will refresh the page to get updated rendering data
- Click on Clear Network Data under the Server-side Fetching Summary table will clear all the current requests logged so far
Note: PerfSSR is intended for analyzing and providing performance insights into Next.js applications in development mode running on localhost:3000
Examples
To see examples of how to set up your app, we’ve included a sample app in the examples folder.
Contributors
James Ye | Summer Pu | Jessica Vo | Jonathan Hosea