React Chartlet
A dead simple and tiny React charting library
Installation
yarn add react-chartlet
Supported Charts
- Sparkline
- Pie
- Bar
- Line
Examples
Sparkline
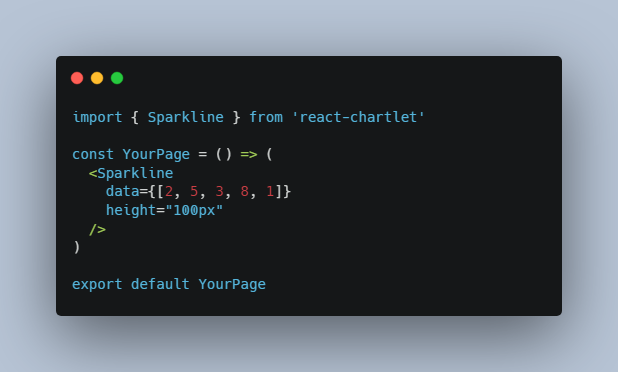
import { Sparkline } from 'react-chartlet'

const YourPage = () => (
  <Sparkline
    data={[2, 5, 3, 8, 1]}
    height="100px"
  />
)

export default YourPage
API Reference
Sparkline
| Property | Type | Default | Description |
|---|---|---|---|
| data | array | [] |
An array of numbers |
| width | string | – | CSS width of your chart |
| height | string | 100% |
CSS height of your chart |
| min | number | smallest datapoint in data array |
The minimum value on the y axis |
| max | number | largest datapoint in data array |
The maximum value on the y axis |
| margin | number or object | { top: 5, bottom: 5 } |
Margin between the border of the chart and the line, either as a number to set all sides, or an object to set specific sides, like { top: 5, right: 5, bottom: 5, left: 5 } |
| style | object | {} |
Directly set the style object of the svg container |
| lineStyle | object | {} |
Set the style object of the line |
Development
To test the components in this library, follow the steps below:
- Clone the repo onto your machine
- Run
yarnto install dependencies - Run
yarn storybookto start Storybook
You can set up stories to test components using this documentation
