@mindinventory/result-doughnut-chart
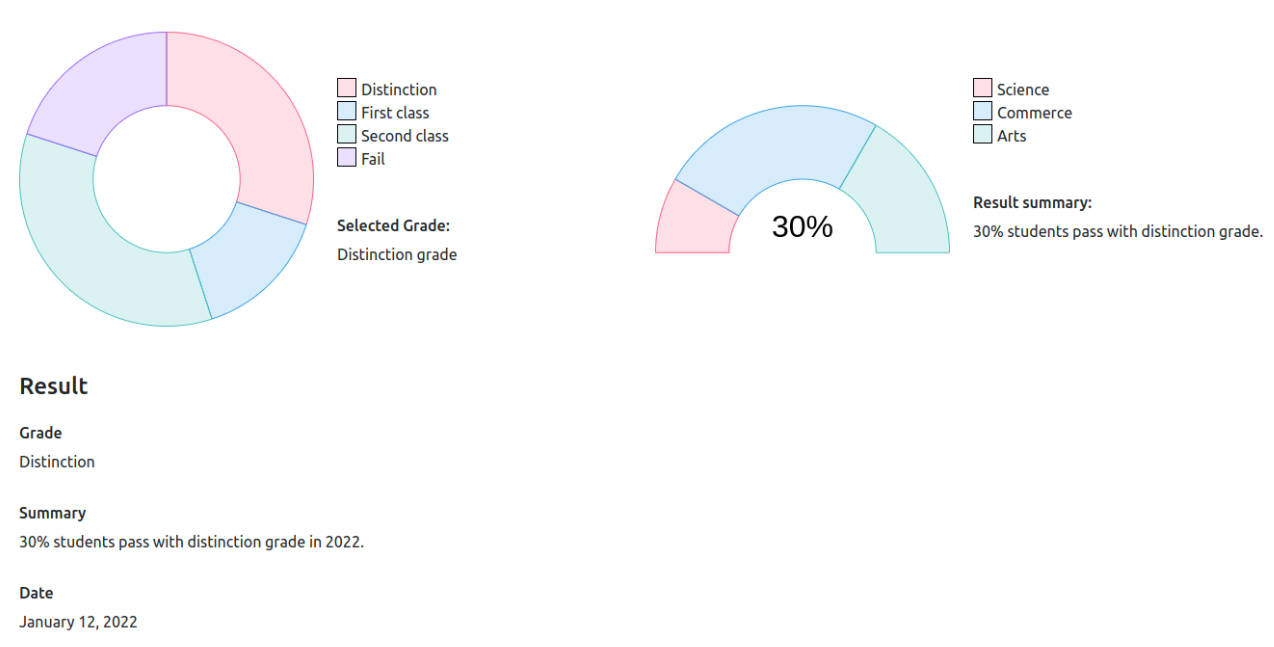
The result doughnut chart is dynamic chart component. Here we show two charts. The first is full doughnut chart when user select any colour section of first chart that time the second chart (half doughnut chart) value change based on first chart selection. Below is the JSON object we used as data for charts. So from there you can change title, colour, text, etc…
Image & video
Image:

Video:
Chart.Demo-React.App.1.mp4
JSON
- Here we use JSON which shows dynamic data & UI in component.
- We can control some UI section based on set of key value as explain below.
- Object key tipData & extraData value pass as empty array ([]).
- Object key firstChartTipTitle & secondChartTipTitle value pass as empty string (“”).
Installation
Install package.
npm i @mindinventory/result-doughnut-chart
Examples
import Chart from "@mindinventory/result-doughnut-chart";

export const apiData = {
  firstChartDataSetLabel: "%",
  secondChartDataSetLabel: "%",
  firstChart: [
    {
      name: "Distinction",
      backgroundColor: "rgba(255, 99, 132, 0.2)",
      borderColor: "rgba(255, 99, 132, 1)",
      data: 30,
      secondChartData: [5, 15, 10],
      secondChartCenterText: "30%",
    },
    {
      name: "First class",
      backgroundColor: "rgba(54, 162, 235, 0.2)",
      borderColor: "rgba(54, 162, 235, 1)",
      data: 15,
      secondChartData: [10, 2, 3],
      secondChartCenterText: "15%",
    },
    {
      name: "Second class",
      backgroundColor: "rgba(75, 192, 192, 0.2)",
      borderColor: "rgba(75, 192, 192, 1)",
      data: 35,
      secondChartData: [7, 18, 10],
      secondChartCenterText: "35%",
    },
    {
      name: "Fail",
      backgroundColor: "rgba(153, 102, 255, 0.2)",
      borderColor: "rgba(153, 102, 255, 1)",
      data: 20,
      secondChartData: [2, 8, 10],
      secondChartCenterText: "20%",
    },
  ],
  secondChart: [
    {
      name: "Science",
      backgroundColor: "rgba(255, 99, 132, 0.2)",
      borderColor: "rgba(255, 99, 132, 1)",
    },
    {
      name: "Commerce",
      backgroundColor: "rgba(54, 162, 235, 0.2)",
      borderColor: "rgba(54, 162, 235, 1)",
    },
    {
      name: "Arts",
      backgroundColor: "rgba(75, 192, 192, 0.2)",
      borderColor: "rgba(75, 192, 192, 1)",
    },
  ],
  firstChartTipTitle: "Selected Grade:",
  secondChartTipTitle: "Result summary:",
  tipData: [
    {
      firstChartTip: "Distinction grade",
      secondChartTip: "30% students pass with distinction grade.",
    },
    {
      firstChartTip: "First grade",
      secondChartTip: "15% students pass with first grade.",
    },
    {
      firstChartTip: "Second grade",
      secondChartTip: "35% students pass with second grade.",
    },
    {
      firstChartTip: "Fail",
      secondChartTip: "20% students fail.",
    },
  ],
  labelExtraData: "Result",
  extraData: [
    {
      grade: "Distinction",
      summary: "30% students pass with distinction grade in 2022.",
      date: "January 12, 2022", //also able to append key & value
    },
    {
      grade: "First",
      summary: "15% students pass with first grade in 2022.",
      date: "January 27, 2022",
    },
    {
      grade: "Second",
      summary: "35% students pass with second grade in 2022.",
      date: "January 19,2022 ",
    },
    {
      grade: "Fail",
      summary: "20% students fail in 2022.",
      date: "January 8,2022  ",
    },
  ],
};

const App = () => {
  return <Chart data={apiData} />;
};

export default App;
License!
@mindinventory/result-doughnut-chart MIT-licensed.