![]()
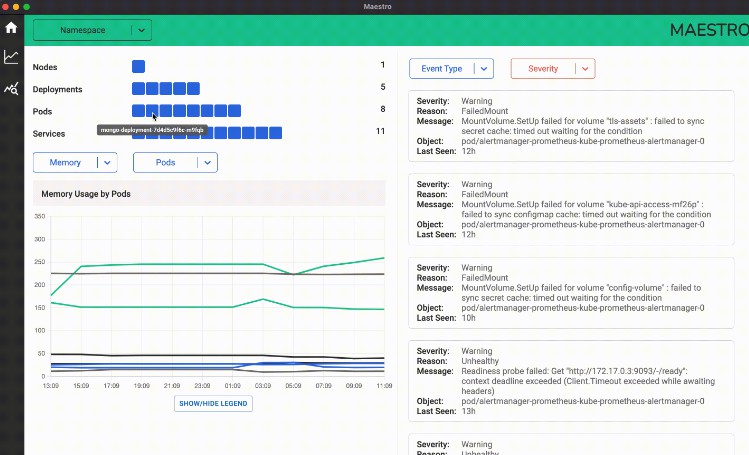
MAESTRO
A Kubernetes monitoring tool built on electron.
Summary
Maestro is an open-source monitoring tool for keeping track of the health of your Kubernetes cluster. Maestro is lightweight and allows users to view key metrics at a glance. This tool leverages the K8s API to obtain important cluster data, and promQL queries to scrape key metrics and display them in a digestible format.
Features
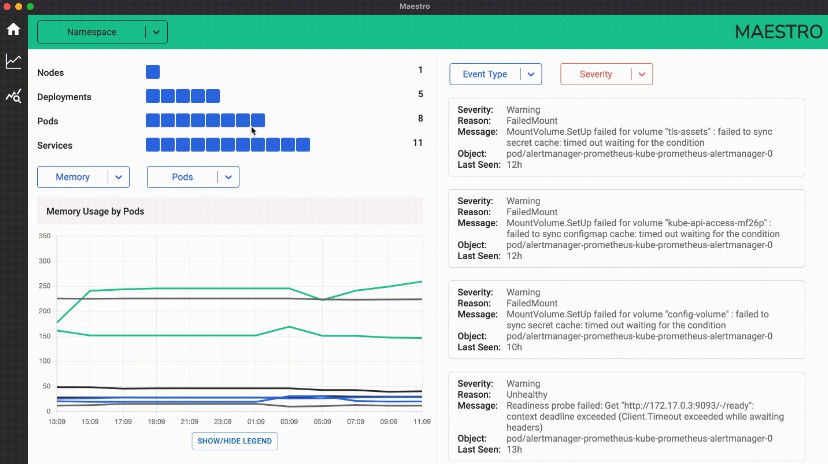
- At a glance overview of nodes, pods, services, and deployments visualized as cubes. Hover over any cube to see which node, pod, deployment, or service you are looking at.

- Log GUI to quickly view alerts and events in an easy to read format, with the ability to sort by severity.

- Graphs displaying key metrics such at CPU usage, memory usage, and network I/O. Multi-colored line graphs map to corresponding properties in the legend, where you can remove properties tht you want to get a more narrowly focused graph.

Getting Started
1. Prerequisites
Users must have Prometheus installed on their Kubernetes cluster.
2. Clone this repo using the following command
https://github.com/oslabs-beta/maestro.git
3. Make sure your cluster is ported forward to port 9090 using the following command
kubectl port-forward -n default svc/prometheus-kube-prometheus-prometheus 9090
4. In the Maestro directory in your terminal, run the following commands
npm install
npm run webpack-start
npm run start
5. Enjoy your Maestro experience!
Built With
The Team
- Peter Kennedy Github LinkedIn
- Aliya Yano Github LinkedIn
- Jakob Schillinger Github
- Alex Ryu Github LinkedIn