react-financial-charts
Charts dedicated to finance with react.js.
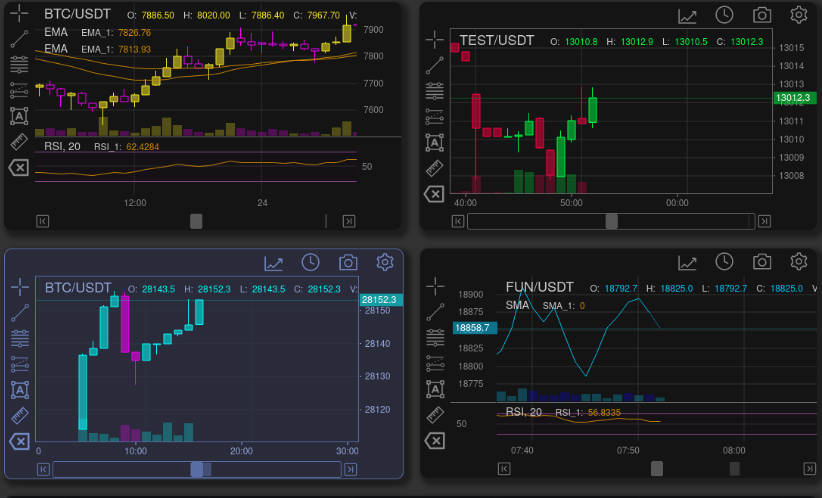
The aim with this project is create financial charts that work out of the box.
Features
- integrates multiple chart types
- over 60 technical indicators and overlays
- drawing objects
Chart types
- Scatter
- Area
- Line
- Candlestick
- OHLC
- HeikenAshi
- Renko
- Kagi
- Point & Figure
Indicators
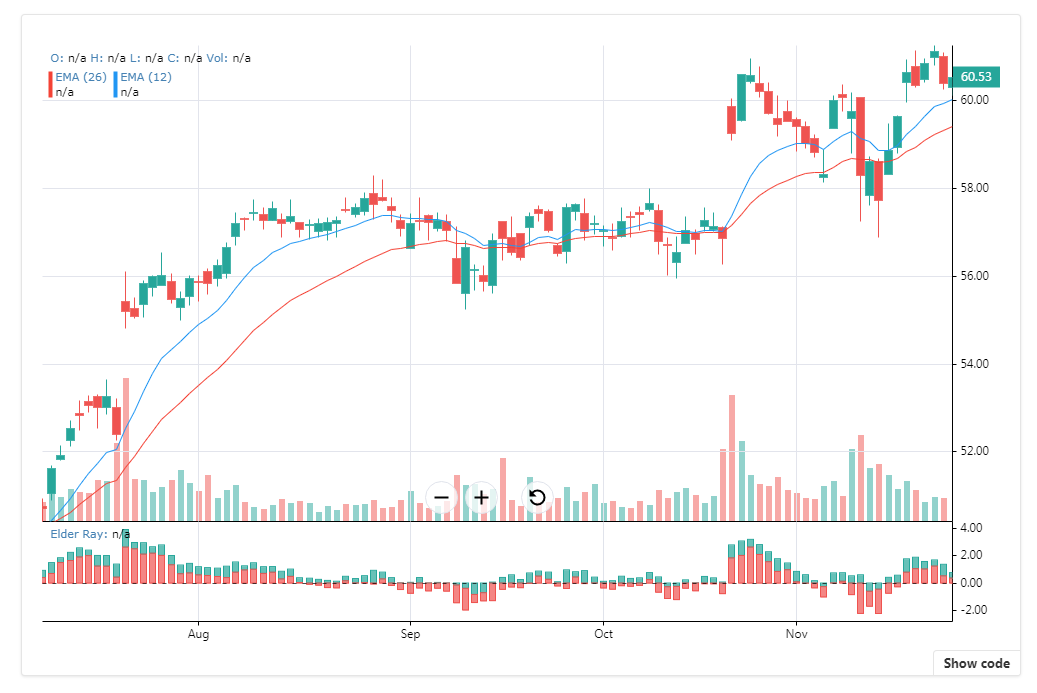
- EMA, SMA, WMA, TMA
- Bollinger band
- SAR
- MACD
- RSI
- ATR
- Stochastic (fast, slow, full)
- ForceIndex
- ElderRay
- Elder Impulse
Interactive Indicators
- Trendline
- Fibonacci Retracements
- Gann Fan
- Channel
- Linear regression channel
Installation
npm install react-financial-charts
Contributing
This project is a mono-repo that uses Lerna to manage dependencies between packages.
To get started run:
git clone https://github.com/reactivemarkets/react-financial-charts.git
cd react-financial-charts
npm ci
npm run build
To start up a development server run:
npm start
Roadmap
- [x] Convert to typescript
- [x] Bump dependencies to latest
- [x] Remove React 16 warnings
- [x] Add CI
- [x] Fix passive scrolling issues
- [x] Implement PRs from react-stockcharts
- [x] Add all typings
- [x] Move examples to storybook
- [ ] Correct all class props
- [ ] Fix issues with empty datasets
- [ ] Migrate to new React Context API
- [ ] Remove all UNSAFE methods
- [ ] Add all series' to storybook
- [ ] Add documentation to storybook
- [ ] Add full test suite
- [ ] Split project into multiple packages