react-composable-charts
yarn add react-composable-charts react d3
? ? This library is WORK IN PROGRESS and there can be a lot of breaking changes.
Examples
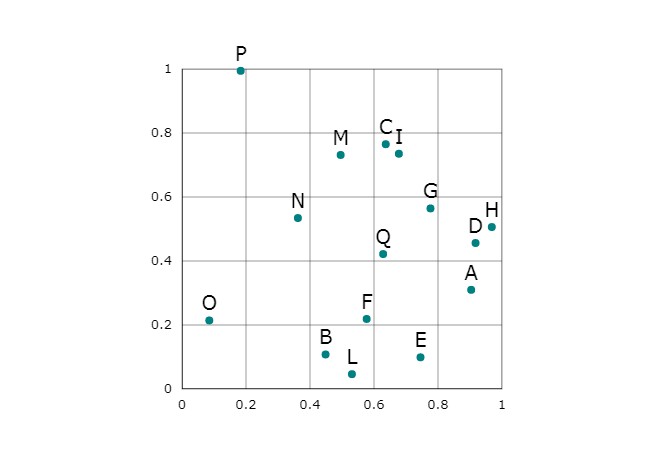
Scatteplot - CodeSandbox
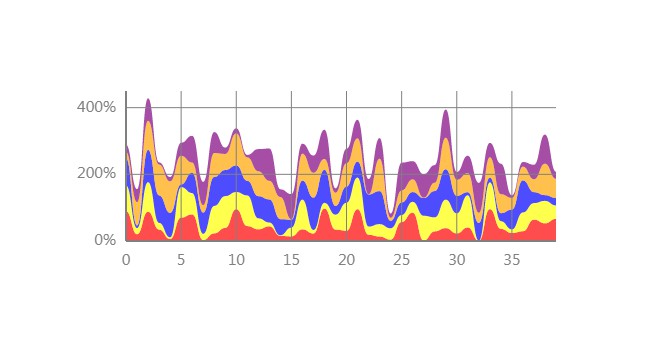
Stacked Area Graph - CodeSandbox
Docs
Components
<Chart />: sets the dimensions and position of the chart<Cartesian />: sets the data domain and scales for a XY chart<Grid />: draws the chart grid. Can be composed by<Grid.XAxes />,<Grid.YAxes />,<Grid.XLines />,<Grid.YLines />,<Grid.XLabels />,<Grid.YLabels /><PointData />: draws a point for every value in the dataset<BarData />: draws a bar for every value in the dataset<RectData />: draws a rect for every value in the dataset<LineData />: draws a line passing through every value in the dataset<AreaData />: draws an area bounded by the dataset<LabelsData />: draws a text for every value in the dataset<LineFunction />: draws a line defined by the given function<AreaFunction />: draws an area bounded by the lines defined by the given functions<ClipRect />: clips children in the given dimensions<ClipChart />: clips children in the chart dimensions<Style />: sets svg attributes to every children. Styles can be nested<Animation />: sets animation properties to every children. Styles can be nested<element. ... />: draws a svg element. The drawn element inherits existing animations and styles
Hooks
useChartContext: returns chart dimensions and positionuseCartesianContext: returns chart scalesuseCascadingStyle: returns svg attributes defined by all nested Style componentsuseComputableStyle: returns svg attributes defined by all nested Style components and preserves given gettersuseCascadingAnimation: returns animation properties defined by all nested Animation components
Utilities
Range: exports utility functions to work with ranges (tuples)wideToNarrow: convert dataset from wide to narrow formatstackNarrow: stacks a narrow format dataset
TODO
- Complete documentation
<Polar />component (radar chart)<Treemap />component- Interactivity (hover, click)
- … more to come