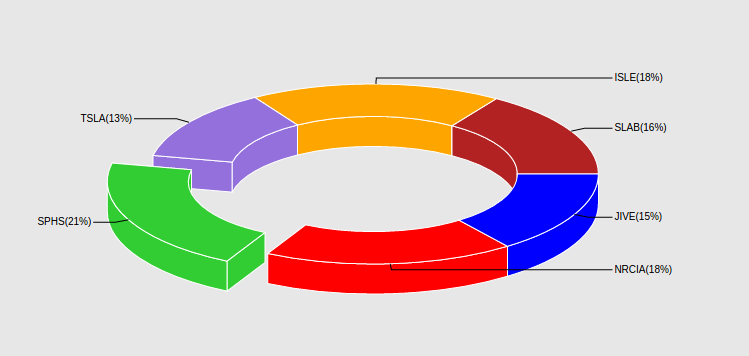
React 3d pie/donut chart
This library is for drawing nice looking pie/donut charts with d3js.
How to install
npm install react-pie3d
How to use it
You can do that both ways:
import Pie3D from 'react-pie3d'
or
require('react-pie3d')
In file:
<Pie3D data={[10, 20, 30]}/>
Pie3D have to props:
data- (requierd) array of numbers or objectsconfig- object with chart config
data can be just simiple array of numbers [10, 20, 30] or array of objects:
Exmaple
var data = [
  {
    value: 10,
    color: 'red',
    label: 'No'
  },
  {
    value: 20,
    color: 'green',
    label: 'Yes'
  },
  {
    value: 5,
    color: 'silver',
    label: 'Others'
  }
];
value- numbercolor- stringlabel- string
Config
config - Object
| Parameter | Default | Decryption |
|---|---|---|
ir |
60 |
Number (min: 0, max: 100) Inner radius in % |
h |
40 |
Number (min: 0) Height of walls in px |
angle |
40 |
Number (min: 0, max: 90) Angle of chart in degrees, when 90 the chart become normal flat pie chart |
size |
100 |
Number (min: 0, max: 100) size in inner html tag in % |
onSliceSelect |
null |
Function on slice click, d => {} |
*d => {}
d = {
	value: ...,        //number
    startAngle: ...,   //number
    endAngle: ...,     //number
    index: ...,        //number
    color: ...,   	   //string
    label: ...		   //string
}
TO DO:
- Labels overriding
- Animations
- Tooltips
- More configurable