![]()
Need direction on your Kubernetes cluster? Kompass can help!
What is Kompass?
Kompass is an easy to integrate, open-source monitoring tool for your Kubernetes cluster. It’s a one-stop shop to visualize and monitor your cluster’s structure and health. Kompass combines an interactive dashboard of your cluster’s structure, a suite of essential tools to monitor time-series data and alerts, and Grafana based dashboards to help users analyze those metrics in real time.
Features
Structure
Our interactive structure page displays your cluster’s architecture along with relevant data like names, IP adresses, and resource allocations.

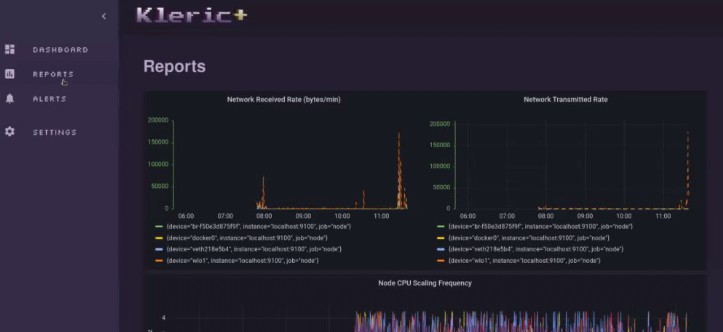
Metrics
Our persisted Grafana dashboards take the guess work out of tracking your cluster’s health. Quickly view your cluster’s resource utilization, network data, or pod health per namespace.

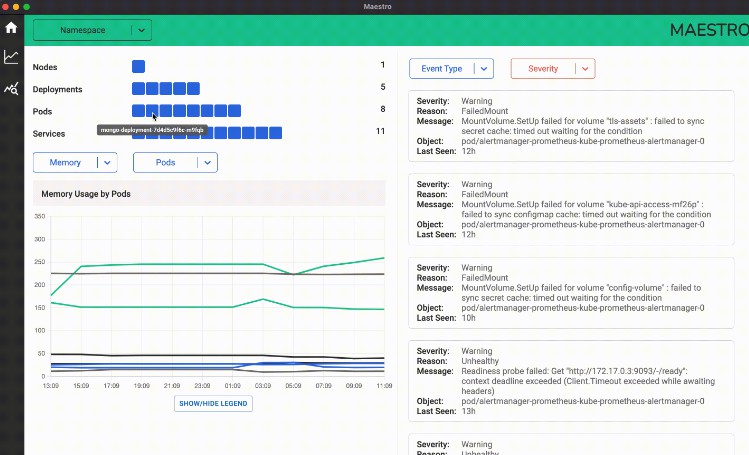
Alerts
Kompass also includes full Prometheus Alerts integration to access alerts, graphs, and direct prom-queries.

Setup
Notes:
- This app assumes you have direct access to your Kubernetes cluster and have Kubernetes CLI (Kubectl) installed.
Clone repo & cd into it, then run:
minikube start --driver=docker

kubectl create namespace monitoring

kubectl apply -f Manifest/
Display your grafana & prometheus pod names:
kubectl get pod --namespace=monitoring
Forward ports to view application:
Open a new tab in your terminal with command+’t’ and forward your grafana port:
kubectl port-forward <grafana-pod-name> --namespace=<namespace-grafana-is-in> 3000:3000
Open a new tab in your terminal with command+’t’ and forward your prometheus port:
kubectl port-forward <prometheus-pod-name> --namespace=<namespace-prometheus-is-in> 9090:9090
Open a new tab in your terminal with command+’t’ and forward your kompass port:
kubectl port-forward <kompass-pod-name> --namespace=<namespace-kompass-is-in> 3036:3036