Argometrics
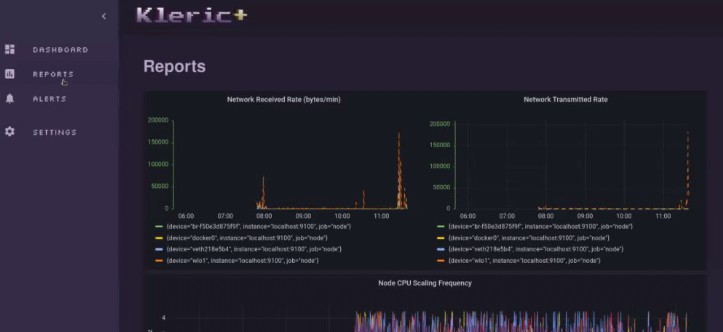
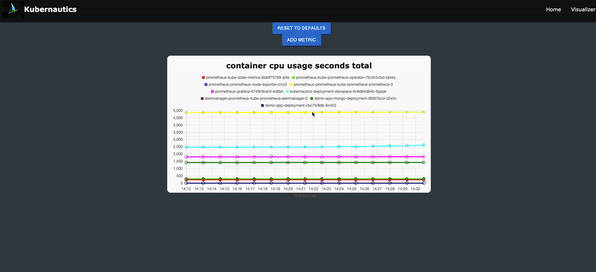
Argometrics is an open source product that allows users to visualize the health of their local Kubernetes clusters. With Prometheus and Grafana scraping and displaying metrics from our cluster, our application visualizes key metrics such as pod and container health, prometheus health, and performance and usage from the cluster in real time. Argometrics allows users to change between clusters at the click of a button, making it easy to monitor all clusters in one location.


Prerequisites
-
Our application works with local kubernetes clusters. Be sure to have a local cluster configured with some type of Kuberenetes implementation (Docker Desktop recommended)
-
Install helm
- You can install on brew using
brew install helm.
- You can install on brew using
Set-Up
-
helm install prometheus prometheus-community/kube-prometheus-stack.- This command deploys Prometheus and Grafana on your local cluster.
-
kubectl patch ds prometheus-prometheus-node-exporter --type "json" -p '[{"op": "remove", "path" : "/spec/template/spec/containers/0/volumeMounts/2/mountPropagation"}]'- This command is for users running on Docker Desktop.
Porting Forward
kubectl port-forward -n default {prometheus podname} {port}- ex:
kubectl port-forward -n default prometheus-prometheus-kube-prometheus-prometheus-0 9090
- ex:
kubectl port-forward -n default {grafana podname} {port}- ex:
kubectl port-forward -n default prometheus-grafana-85978cf69c-29dw9 3000
- ex:
How To Change Grafana Settings Via Grafana Config
-
kubectl get deployment- Find the deployment associated with Prometheus and Grafana
-
kubectl edit configmap {deployment}- Opens up vi file of Prometheus/Grafana configmap
- add this code under grafana.ini
[security] allow_embedding: true [auth.anonymous] enabled: true- HELPFUL VI COMMANDS
i-> To edit the file ( you will see ‘INSERT’ at bottom )ESC-> Escape edit mode back to command mode- Common commands in command mode
:wq-> Write quit ( when you make an update ):q!-> Force quit without saving changes
- HELPFUL VI COMMANDS
- Restart docker desktop or whatever virtualization software is being used
- Forward your ports again and the changes to grafana.ini should be reflected in settings tab
Adding Dashboards
- Port forward your grafana pod and open up the dashboards page
- There should be an option to import dashboards on the righthand side.
- Inside of the dashboardJson folder in our application, we have precofigured graphs. Simply copy paste into the import.
Useful Helm AND K8 Commands
helm listhelm repo listkubectl --namespace default get pods -l "release=prometheus"kubectl get secret --namespace {namespace} {podname} -o jsonpath="{.data.admin-password}" | base64 --decode ; echo
Launching the app
- To launch Argometrics
- Create a .env file in the root directory with the following variables
ATLAS_URI = {your MongoDB URI}GOOGLE_CLIENT_ID = {Google Client ID}GOOGLE_CLIENT_SECRET = {Google Client Secret}
npm installnpm run devnpm electron-start
- Create a .env file in the root directory with the following variables
Contributions
We are always looking for improvement and are open to feedback. If you had a feature suggestion, please fork and clone this repo and make a pull request with your new branch.
- Fork our repo
- Clone it to your local machine
git checkout -b newFeatureBranchin terminal to enter a new branch- Add and commit your changes once the modifications have been made
git push origin newFeatureBranch- Make a pull request from the newFeatureBranch
Potential Features for Iteration
- Built in CLI
- KEDA integration with our application
- Cloud cluster compatibility
- Setting up ingress to stabilize the cluster connection
We originally planned to deploy our application with KEDA and give the user the ability to choose metrics to scale by. Our command line interface would allow the user to add loads to their cluster and the user could test how their cluster health performed under different environments and different scaled objects. Additionally, port-forwarding is currently being used to make our cluster available to our application. We did not know at the time but this causes many instability issues. Moving forward, either making our application compatible with cloud clusters and/or using an ingress instead of porting forward to connect the cluster with our application are things to consider when iterating.
Authors
- Ryan Sun – Github | LinkedIn
- Taylor Ball – Github | LinkedIn
- Joey Schwartz – Github | LinkedIn
- Alex Yam – Github | LinkedIn
- Jake Crawford – Github | LinkedIn
Technologies Icon Reference
Technology icons by shields.io