Manhattan Antennas Performance
Antennas.mp4
If you want to try it right now, clone the project and run:
docker-compose up
After a successful build:
# Check in your browser
localhost:3000

# Alternatively connect to:
# Materialize
psql postgresql://materialize:materialize@localhost:6875/materialize

# Postgres
psql postgresql://postgres:pg_password@localhost:5432/postgres
Let’s begin.
An infrastructure working safe and healthy is critical. We, developers, know this very well. In other businesses, like in software, there are vital infrastructures, such as mobile antennas (4G, 5G) in telecommunications companies.
If there is some issue, it needs to be detected quickly; otherwise, customers will complain, or even worse, move to the competition (churn rate is serious business).
Antennas manufacturers share key performance indicators with their telecommunications companies clients. Let’s call all these indicators “performance”. Rather than setting a 5G antenna manually to provide indicators, let randomness generate this value, providing even more excitement and entertainment to the case than in real life.
Each antenna has a fixed range where is capable of serving clients. In a map, a green, yellow, or red (healthy, semi-healthy, and unhealthy) circle will denote this area.
If the last-minute average performance is greater than 5, the antenna is healthy.
If it is greater than 4.75 but less than 5, it is semi-healthy.
If it is less than 4.75, the antenna is unhealthy.
All this information needs to be processed and served, and that’s where Materialize will do the work for us efficiently.
Detailes steps
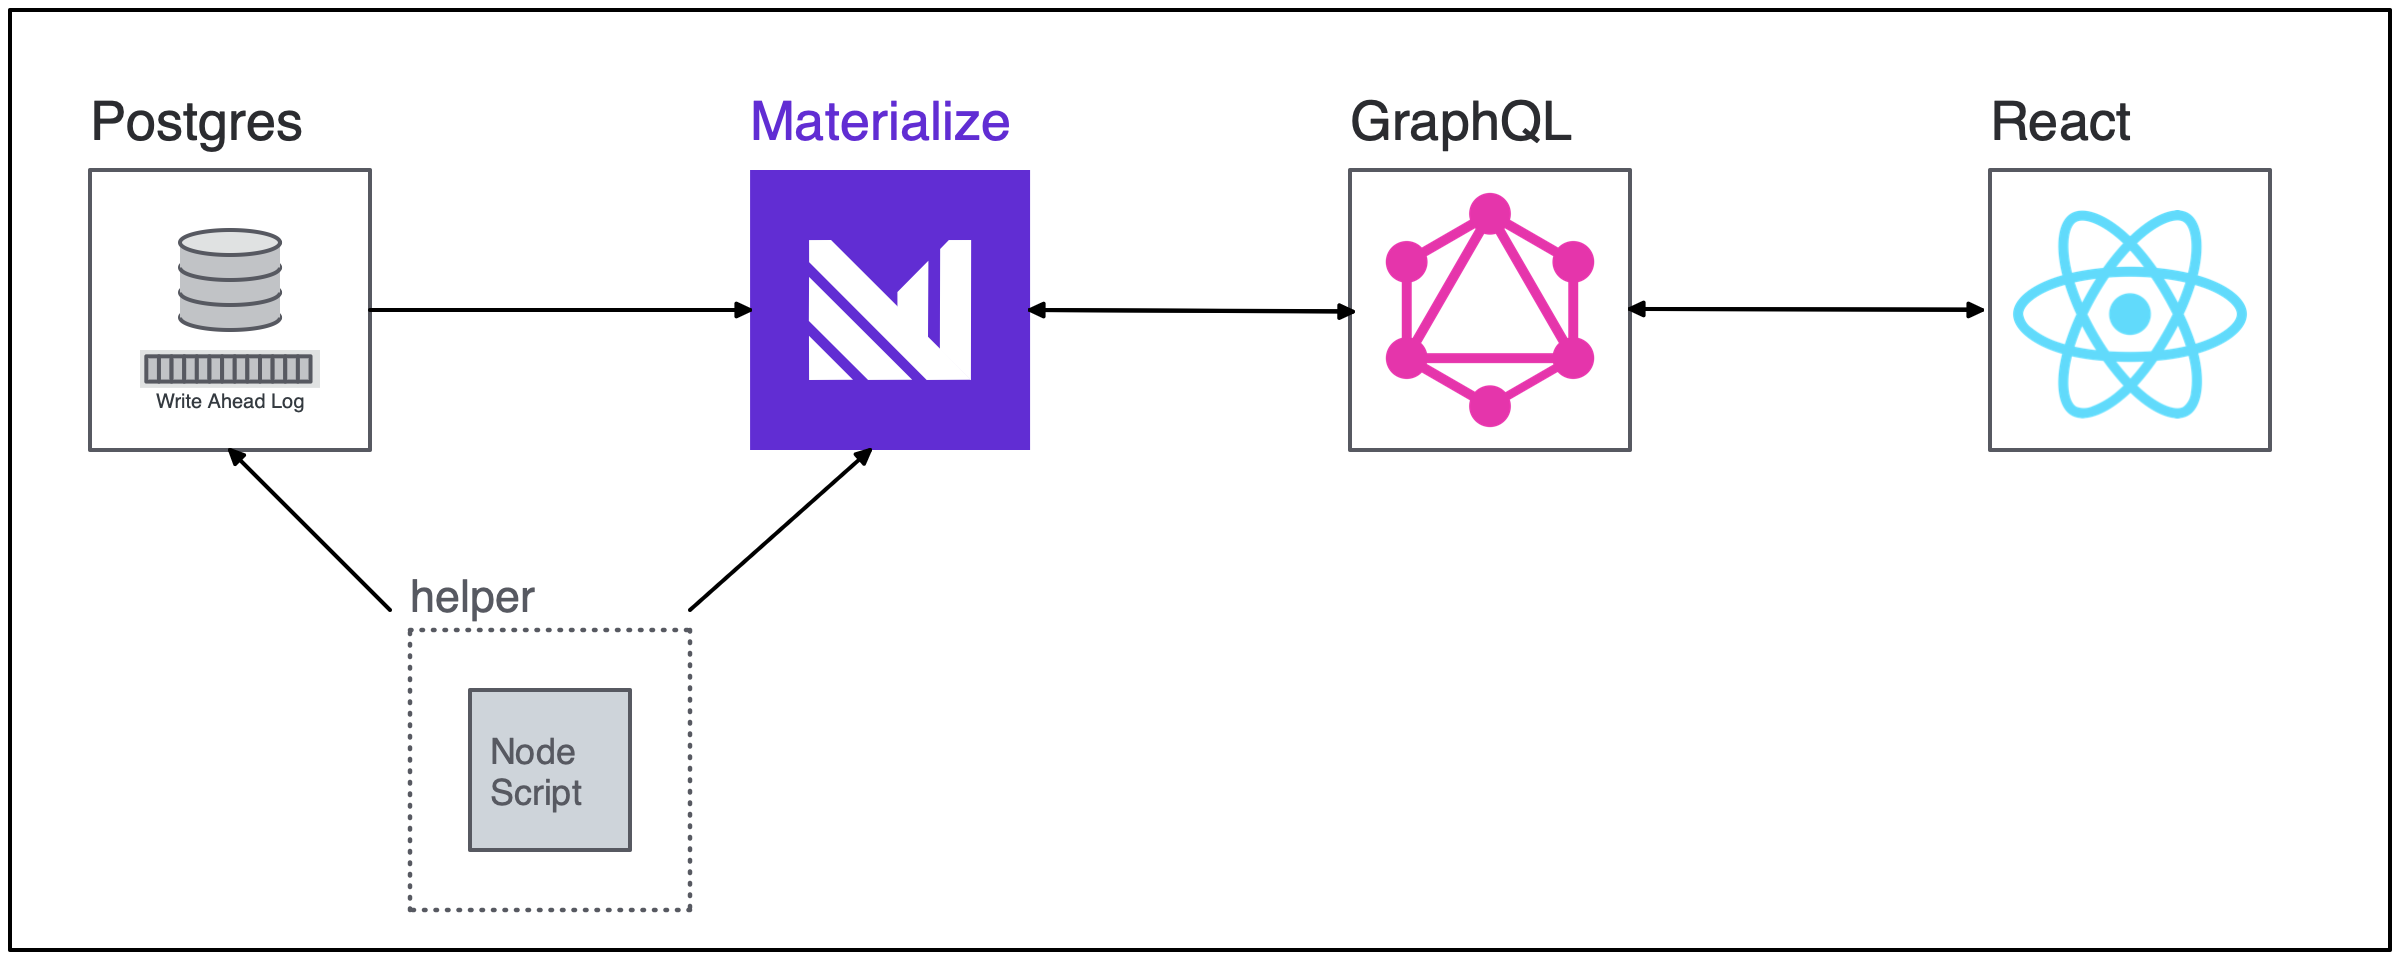
There are different ways to achieve a result like this one using Materialize, but for this case, the following strategy fulfill our needs:
- Postgres, where all the base data resides.
- Materialize to process and serve the antenna’s performance.
- Helper process to generate the antennas random data and initialize Materialize
- Node.js GraphQL API connects to Materialize using tails.
- React front-end displaying the information using GraphQL subscriptions.
Our source, Postgres, could be alternatively replaced with any other Materialize source
- To begin with, Postgres needs to be up and running. You can reuse this custom image with SQLs and shell scripts that will get executed in Postgres initialization.
The scripts creates the schemas and defines everything we need to use them as a source:
-- Antennas table will contain the identifier and geojson for each antenna.
CREATE TABLE antennas (
    antenna_id INT GENERATED ALWAYS AS IDENTITY,
    geojson JSON NOT NULL
);


-- Antennas performance table will contain every performance update available
CREATE TABLE antennas_performance (
    antenna_id INT,
    clients_connected INT NOT NULL,
    performance INT NOT NULL,
    updated_at timestamp NOT NULL
);


-- Enable REPLICA for both tables
ALTER TABLE antennas REPLICA IDENTITY FULL;
ALTER TABLE antennas_performance REPLICA IDENTITY FULL;


-- Create publication on the created tables
CREATE PUBLICATION antennas_publication_source FOR TABLE antennas, antennas_performance;


-- Create user and role to be used by Materialize
CREATE ROLE materialize REPLICATION LOGIN PASSWORD 'materialize';
GRANT SELECT ON antennas, antennas_performance TO materialize;
2-3. Once Postgres is up and running, Materialize will be ready to consume it. If you are automating a deployment, a helper process can do the job to set up sources and views in Materialize and also feed Postgres indefinitely with data.
The SQL script to build Materialize schema is the next one:
  -- All these queries run inside the helper process.


  -- Create the Postgres Source
  CREATE MATERIALIZED SOURCE IF NOT EXISTS antennas_publication_source
  FROM POSTGRES
  CONNECTION 'host=postgres port=5432 user=materialize password=materialize dbname=postgres'
  PUBLICATION 'antennas_publication_source';


  -- Turn the Postgres tables into Materialized Views
  CREATE MATERIALIZED VIEWS FROM SOURCE antennas_publication_source;


  -- Filter last minute updates
  CREATE MATERIALIZED VIEW IF NOT EXISTS last_minute_updates AS
  SELECT A.antenna_id, A.geojson, performance, AP.updated_at, ((CAST(EXTRACT( epoch from AP.updated_at) AS NUMERIC) * 1000) + 60000)
  FROM antennas A JOIN antennas_performance AP ON (A.antenna_id = AP.antenna_id)
  WHERE ((CAST(EXTRACT( epoch from AP.updated_at) AS NUMERIC) * 1000) + 60000) > mz_logical_timestamp();


  -- Aggregate by anntena ID and GeoJSON to obtain the average performance in the last minute.
  CREATE MATERIALIZED VIEW IF NOT EXISTS last_minute_performance_per_antenna AS
  SELECT antenna_id, geojson, AVG(performance) as performance
  FROM last_minute_updates
  GROUP BY antenna_id, geojson;
Antennas data generation statement:
  -- Insert data using the helper process.
  INSERT INTO antennas_performance (antenna_id, clients_connected, performance, updated_at) VALUES (
    ${antennaId},
    ${Math.ceil(Math.random() * 100)},
    ${Math.random() * 10},
    now()
  );
-
Now, the information should be ready to consume.
The back-end works with Graphql-ws. Subscriptions and tails go together like Bonnie and Clyde. Multiple applications send ongoing events to the front-end with sockets or server-sent events (SSE), becoming super handy to use with
tails. Rather than constantly sending queries back-and-forth, we can run a singletail last_minute_performance_per_antenna with (snapshot)and send the results more efficiently.The back-end will use a modified client to run these tails. It implements internally Node.js stream interfaces to handle backpressure, create one second batches and group all the changes in one map (summary).
-
The front-end doesn’t require going deep since it will consist of only one component. Apollo GraphQL subscribes to our back-end, and the antennas information gets displayed in a list and a visual map. The frequency at which the information updates is every one second.