Graphnavi
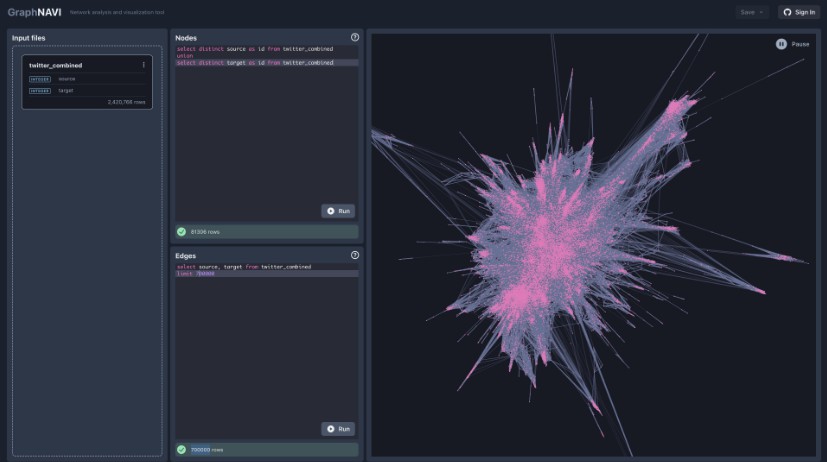
Network analysis and visualization tool: graphnavi.vercel.app

graphnavi-50.mp4
Rationale
Network analysis tools can be intimidating, and especially, the data preparation in the form that these tools expect (which often involves combining multiple datasets) can be very time consuming. SQL is a very powerful and quite popuar language for data analysis and manipulation which can be of immense help for the data preparation. However, setting up a database with an SQL query engine is often a tedious process. Thanks to DuckDB we can now run an efficient SQL database, execute queries directly in the browser and pass the results to a graph layout engine to visualize them as a network.
Roadmap
- Non-expert mode not requiring familiarity with SQL
- Support for more visual attributes: node sizes, colors, edge thickness, color, edge labels
- Saving added datasets and queries to GitHub Gists
- Query history
- Table view for the input files and for the query results (e.g. one two) three
- Pass table schema to the query auto-completion engine
- More efficient data structures (arrow) for the graph/layout to support larger graphs
- Graph layout taking node/edge weights/importance into account (e.g. like this one)
- Consider using other graph rendering approaches: one, two, three
- Weighted one, two, three, four
- Potentially: Try again to integrate Graphistry.js
Development
npm install
npm run dev
# or
yarn
yarn dev
License
GraphNAVI is free non-commercial usage. If you want to use it in a commercial project, please reach out to [email protected].