![]()
Palaemon ?
- A gentle, euthanization and diagnosis tool for out-of-memory (OOM) kubernetes pods.
- Palaemon is a Greek, child sea-god who came to aid sailors in distress. He was often depicted as riding a dolphin. Also, a genus of shrimp.
Running the Electron App
Prerequisites:
- kubectl installed
- Prometheus installed
- Prometheus port-forwarded to
localhost:9090
Launching in dev mode with Hot-Module Reload (HMR):
If this is the first time launching the app then run the following commands:
npm install
npm run build
This will build your initial dist folder.
Then on a different terminal run
npm run electronmon
The build command for webpack will run webpack with the –watch flag to watch for any changes in the files, and rebuild the dist folder when any files are changed. Electronmon is watching the dist folder for any changes and will either refresh or relaunch the electron app when it detects any of the dist folder files have been changed.
After the initial build, you can now run the following command:
npm start
This which will first delete the old dist folder from your app, and concurrently launch the webpack to build and electronmon to wait for the new dist folder to be built.
If the build process was interrupted through CTRL + C or other means, then you may receive the following error:
Error: ENOENT: no such file or directory, stat 'dist'
In this case, just run the command below, and wait for webpack to finish building. After webpack has finished, you can start the app normally.
npm run build
Launching in production mode:
The command below will build and bundle files into /dist folder for production and open the electron app based on the bundled files from /dist.
npm start:production
Using Palaemon
- On a successful startup, you will be greeted with a landing page allowing you to select a namespace to be analyzed.
- After selecting your namespace, you will be moved to the home page
- The home page is where you can find a list of all events, alerts, and OOMKills
- Events are limited to occurences within the last hour due to a kubectl limitation.
- OOMKill events are not limited to the last hour.
- The lefthand side will show you all of your pods within the namespace.
- The color of the squares represent the memory usage vs memory limit of the pod, with green pods using less memory than their requested amount.
- Black pods indicate that no data was available for that pod.
- When the OOMKill type is seleceted, an
Analyzebutton will appear, where you can click that to be taken to theAnalysispage.- Here is where you can find all of the information on your node and other pods at the time of death, along with pertinent events.
Kubernetes Requirements
Palaemon utilizes the kubernetes command line tool (kubectl) to gather data on your nodes and clusters. Kubectl can be downloaded and installed here.
Minikube can also be used to test out Palaemon. More can be found on their official documentation here.
Palaemon has not yet been tested with Amazon Elastic Kubernetes Service (EKS) or Microsoft Azure Kubernetes Service (AKS), but should be compatible provided that kubectl can access all cluster and node information.
How to Connect to Google Kubernetes Engine
- Install gcloud CLI on your local machine from here
- If you have having problems with the gcloud CLI, try using the command below and make sure to update your $PATH
curl https://sdk.cloud.google.com | bash
- If you are still having issues, trying restarting your terminal.
- Initialize the gcloud CLI following the steps here
- Connect your gcloud CLI to your GKE cluster here
- Follow the steps here to deploy the Prometheus UI, and you can forward the prometheus UI to local port 9090
Prometheus Requirements
Palaemon utilizes Prometheus to scrape for data on your pods. Therefore, please ensure you have Prometheus installed on your node.
PATRICK, PLEASE INCLUDE HOW TO INSTALL PROMETHEUS HERE
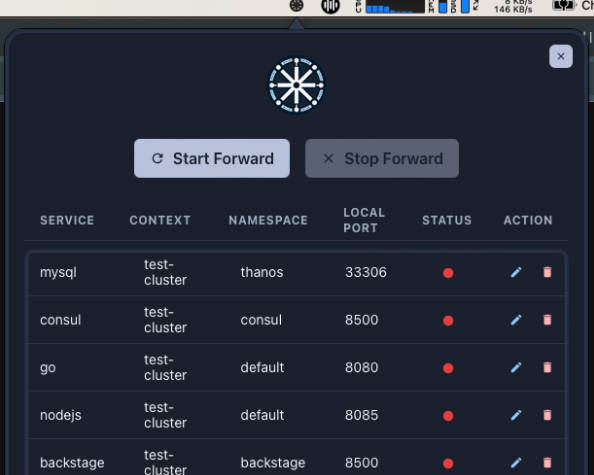
Connecting Prometheus to Palaemon:
Make sure a Prometheus pod is installed onto your node/cluster, and forward its port (default 9090) to your localhost. The following command is a sample of how you can forward the port.
kubectl port-forward -n monitoring service/operator-kube-prometheus-s-prometheus 9090
- The -n flag indicates the namespace that the pod is assigned to.
- A list of all available services can be found through typing the command below in the terminal.
kubectl get services -A
Find the service with a 9090/TCP Port assigned, and forward that service to your local 9090.
How to Run Tests
Unit and Integration tests using Jest
The jest testing suite will start with the command below. The --watch flag is enabled, which allows for immediate retests upon save. The jest config in jest.config.js is set up to only look for and run test files within the __test__ folder and with file names that include “.test.” in them, such as “Events.test.tsx”.
npm run test:watch
Units tests are set up using Jest testing suite and react-testing-library to test react components in the front end.
End-to-End testing with Playwright Test Runner
npm run test:e2e will execute the playwright test runner and run any test files in the __test__ folder with the name format “.e2e.” in them, such as “playwright.e2e.ts”.
There are settings to enable HTML report and video, snapshot, trace recordings that can be configured in the playwright.config.ts file is fo desired.
Features
- Realtime Pod memory usage, sorted by namespaces
In Progress Features
- Populate the remaining in-progress features.
Built With
The Team
- Si Young Mah Github LinkedIn
- Patrick Hu Github LinkedIn
- Thang Thai Github LinkedIn
- Raivyno Lenny Sutrisno Github LinkedIn