??? Power plants map
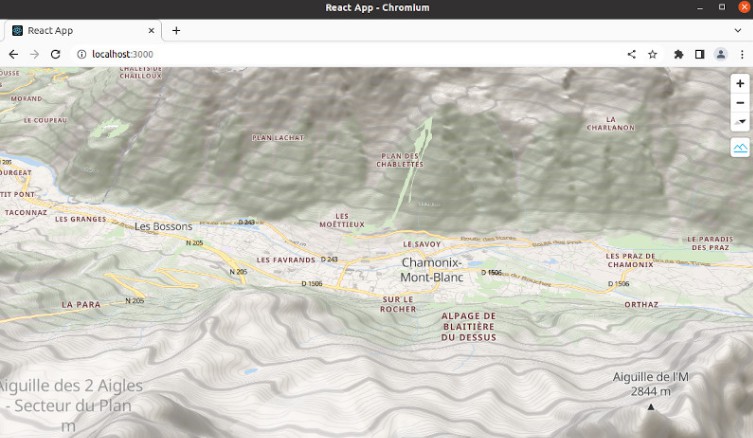
Power plants map shows how to visualize GeoJson data on a map as 3-D charts
Description:
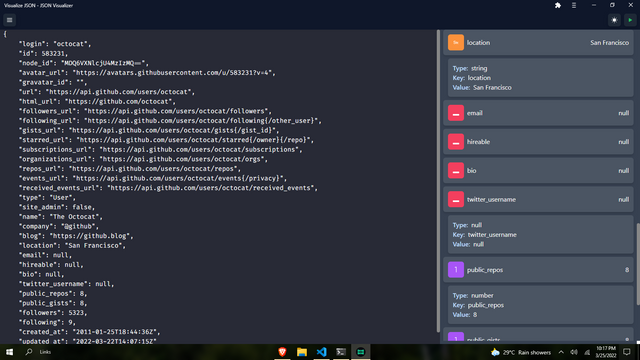
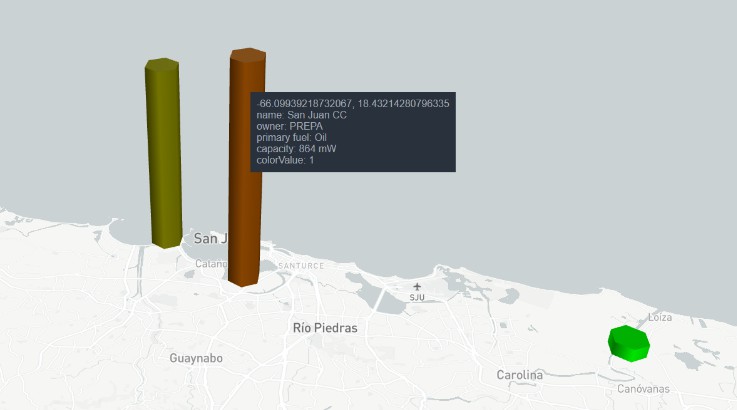
GeoJson file contains power plants names, coordinates, power, type of fuel, owner and others.
Power plants are displayed on the map by their coordinates in the form of a 3-D charts.
The height of chart corresponds to the power of the power plant and the color corresponds to the type of fuel used.
When you hover over an object, detailed information about it is displayed.
Demo:


Scripts:
Install Dependencies:
yarn install