Airgapped React Maplibre visualization

react-maplibre-standalone is a React MapLibre visualization demonstration using local only GIS data with no API-key or dependency on third-party service. Repository could be used as a sample for a standalone map visualization application or in an airgapped environment. This tutorial is a Work In Progress, see the openned Github issues.
React integration is a copy of the excellent MapTiler tutorial: https://docs.maptiler.com/react/maplibre-gl-js/how-to-use-maplibre-gl-js/ (MIT, (C) MapTiler)
Our objective is to build a Maplibre web application with the following features:
- A vector OSM layer.
- A terrain digital elevation model to view our vector OSM layer in 3D with hill-shading.
- A terrain contour model since our application is oriented “outdoor”.
react-maplibre-standalone is built with pre-processed data:
git clone https://github.com/cneben/react-maplibre-standalone
cd react-maplibre-standalone
npm install
npm start
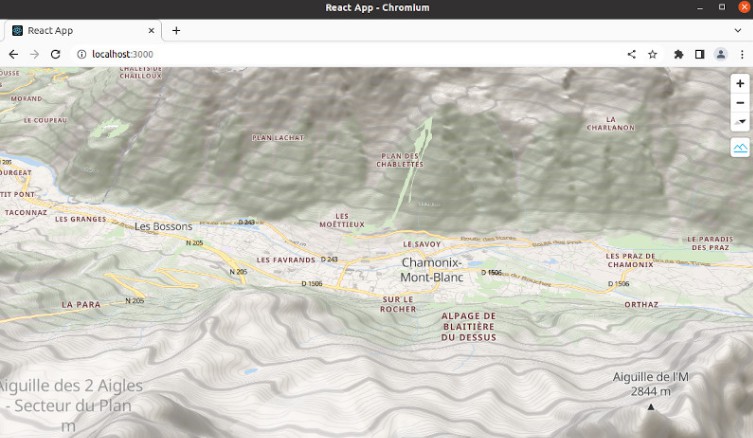
Web application is available at: http://localhost:3000
This README.md describe the process for generating your own GIS data:


External resources:
Our demonstration is located in Chamonix since it offer both a dense urban environment and interesting terrain features:
- Map is centered on:
$CENTER = [45.92, 6.87]in decimal degrees. - All layers are cropped around Chamonix using the following bounding box:
$BBOX = [6.54, 46.04, 7.16, 45.77]. - Zoom will be
[0, 16].
 .
 +-- data/                         # Used to generate gis data
 |   +-- tilemaker/
 +-- react-maplibre-standalone/    # Git clone of this repository
     +-- public/
This tutorial has been tested on an Ubuntu 20.04 system with GDAL 3.0.4 and QGIS 3.26.1:
sudo apt-get install gdal-bin
ogrinfo --version
GDAL 3.0.4, released 2020/01/28
OSM vector layer:
Create a .osm for target area
There is significant limitation on API calls you can do on openstreetmap.org, extracting a large area to .osm XML/vector format might be tricky.
A more robust procedure is to download a regional .pbf extract from GeoFabrik and crop this extract to the desired bounding box before converting resulting .pbf to .osm with osmium.
For Chamonix, the rhone-alpes-latest.osm.pbf regional .pbf extract can be downloaded directly from GeoFabrik:
wget https://download.geofabrik.de/europe/france/rhone-alpes-latest.osm.pbf
sudo apt install osmium-tool
osmium extract --set-bounds -b 6.54,46.04,7.16,45.77 rhone-alpes-latest.osm.pbf -o chamonix_osm.pbf
osmium arguments:
-
--set-boundsis a mandatory option: without a global bounding box being added to output.pbf,tilemakertool will fail with the following error: “Can’t read shapefiles unless a bounding box is provided”. -
.pbf: Usually vector tiles serialized in Protocol Buffer format. -
.mbtiles: MabBox Tiles, a sqlite3 container for a regular Z/X/Y tiles directory (plus metadata), tiles can be raster (PNG, …) or vector (PBF).
Convert .osm to .pbf vector tiles:
Our OSM pbf extract must be converted to vector tiles in a Maplibre compliant format. The tilemaker (https://github.com/systemed/tilemaker) tool is able to generate theses tiles using an input JSON configuration
From data directory, tilemaker could be installed with:
git clone [email protected]:systemed/tilemaker.git
cd tilemaker
sudo apt install build-essential libboost-dev libboost-filesystem-dev libboost-iostreams-dev libboost-program-options-dev libboost-system-dev liblua5.1-0-dev libprotobuf-dev libshp-dev libsqlite3-dev protobuf-compiler rapidjson-dev
make
sudo make install
tilemaker need additional data for processing coastline and landuse, this data is not packaged in your chamonix_osm.pbf it need to be downloaded from OSMData and NaturalEarth:
Install landuse vectors from NaturalEarth:
wget https://github.com/nvkelso/natural-earth-vector/archive/refs/tags/v5.1.2.zip
unzip v5.1.2.zip
mkdir -p landcover/ne_10m_urban_areas
cp natural-earth-vector-5.1.2/10m_cultural/ne_10m_urban_areas.* landcover/ne_10m_urban_areas
mkdir -p landcover/ne_10m_antarctic_ice_shelves_polys
cp natural-earth-vector-5.1.2/10m_physical/ne_10m_antarctic_ice_shelves_polys.* landcover/ne_10m_antarctic_ice_shelves_polys
mkdir -p landcover/ne_10m_glaciated_areas
cp natural-earth-vector-5.1.2/10m_physical/ne_10m_glaciated_areas.* landcover/ne_10m_glaciated_areas
Install coastlines vectors:
wget https://osmdata.openstreetmap.de/download/water-polygons-split-4326.zip
unzip water-polygons-split-4326.zip
mv water-polygons-split-4326 coastline
You should now have coastline and landcover folders. See this blog post for more details: https://smellman.hatenablog.com/entry/2021/12/31/175657.
 .
 +-- data/
 |   +-- landcover/
 |   +-- coastline/
 |   +-- tilemaker-config-standalone.json    # Available from this repository config/ folder
 |   +-- chamonix_osm.pbf                    # Input OSM file
 |   +-- tilemaker/
It is now possible to convert you chamonix_osm.pbf to vector .mbtiles, but a specific configuration must be provided to tilemaker:
tilemaker --input chamonix.osm.pbf --output chamonix_osm.mbtiles --process ./tilemaker/resources/process-openmaptiles.lua --config ./tilemaker-config-standalone.json
Default ./tilemaker/resources/config-openmaptiles.json is working fine, but tiles compression should be disabled for offline use (See this github issue):
"compress": "none"
Since we are “server less”, maplibre can’t directly render .mbtiles and our tiles must be “unpackaged” to a simple Z/X/Y folder structure using mb-util:
Extract mbtiles to OSM vector pbf Z/X/Y folders:
mb-util --image_format=pbf chamonix_osm.mbtiles chamonix_osm
FIXME: border effect, extract strategy…
References:
- “3D Terrain in MapLibre 2.2”: https://www.youtube.com/watch?v=sjf4GNaHtpY
- “Tilemaker Tips”: https://www.youtube.com/watch?v=q8mnyV7be1c
Terrain DEM
Data source
For simplicity we choose to use well known USGS SRTM DEM tiles downloaded from QGis using the “SRTM Downloader” plugin. You need to register to EarthData (https://www.earthdata.nasa.gov/) and provide your user/password to STRM Downloader plugin:

Using the Chamonix BBOX, you should end up with 4 .hgt files that are easy to process with GDal.
We have been very successful with other DEM sources:
- Worldwide:
- Japan PALSAR2 https://www.eorc.jaxa.jp/ALOS/en/dataset/fnf_e.htm (approx 25m resolution).
- Europe:
- France:
- IGN / BD ALTI: https://geoservices.ign.fr/bdalti (approx 25m resolution)
Process SRTM to GeoTIFF
The more effective way is to build a GDAL VRT (Virtual format) to merge our multiple .hgt in a single project file. This virtual project can then be re-projected and interpolated to WGS84 using gdalwarp and finally translated to a single geo tiff with gdal_translate:
STRM Downloader output folder is SRTM_chamonix (4 .hgt files):
gdalbuildvrt -overwrite -srcnodata -9999 -vrtnodata -9999 SRTM_chamonix_area.vrt SRTM_chamonix_area/*.hgt
gdalwarp -r cubicspline -t_srs EPSG:3857 -dstnodata 0 -co COMPRESS=DEFLATE SRTM_chamonix_area.vrt SRTM_chamonix_area_WGS84.vrt
gdal_translate -of GTiff -co COMPRESS=LZW -co BIGTIFF=YES -co TILED=YES SRTM_chamonix_area_WGS84.vrt chamonix_area.tiff
To crop your “area DEM” to OSM data bounding box you need to extract the bounding box with osmium fileinfo command and then to apply crop with gdalwarp with a bbox in correct SRS:
$ osmium fileinfo chamonix_osm.pbf
...
Header:
  Bounding boxes:
    (6.54,45.77,7.16,46.04)
Remove , in gdalwarp input:
gdalwarp -te 6.54 45.77 7.16 46.04 -te_srs EPSG:4326 chamonix_area.tiff chamonix_terrain.tiff
Ouput product chamonix_terrain.tiff will be used to render elevation tiles and build vector contour lines.
Note: gdalwarp [-te xmin ymin xmax ymax] need a box in source SRS (EPSG:3857), get the value in QGIS/Layer properties/metadata/extent the osimum bound need to be re-ordered and converted from decimal degrees.
References:
Process GeoTIFF to elevation tiles
Geo tiff must now be converted to raster tiles compatibles with Maplibre terrain layers. rasterio rgbify tool might be used to generate a .mbtiles:
Install rasterio:
python3 -m pip3 install rasterio==1.2.0
rio --version
Generate elevation image tiles from .tiff raster:
rio rgbify -b -10000 -i 0.1 --min-z 0 --max-z 12 -j 8 --format png chamonix_terrain.tiff chamonix_terrain.mbtiles
Use --format webp to use more compression.
| Format | PNG | WEBP |
|---|---|---|
| Size (mb) | 33.2mb | 21.3mb |
There is an issue with rio-rgbify > 1.2.0, see mapbox/rio-rgbify#39
Tiles can be extracted to a png Z/X/Y folder using mb-util:
mb-util --image_format=png chamonix_terrain.mbtiles chamonix_terrain
References:
Contour lines generation
There is two Github references repositories to generate terrain contour:
Unfortunately, we have not been successful with their ogr2ogr method:
ogr2ogr -f GeoJSONSeq -sql 'SELECT * FROM Elev_Contour WHERE ContourElevation % 40 = 0.0' $geojson_name $elev_file
Contour lines could be generated manually using gdal_contour and tippecanoe:
gdal_contour -a height -i 50 chamonix_terrain.tiff -f GeoJSONSeq chamonix_contours_50m.geojson
gdal_contour main arguments:
-a height: Export andheight(ie elevation) argument for every polylines (in meters). Must be consistent with tippecanoe-yargument.-i 50: Generate a polyline every 50 meters.gdal_contourdefault output is.shp, exporting directly to geojson avoid anogr2ogrcall.
tippecanoe is easy to build and install on Ubuntu:
sudo apt-get install build-essential libsqlite3-dev zlib1g-dev
git clone https://github.com/mapbox/tippecanoe.git
cd tippecanoe
make -j
make install
Then, your chamonix_contours_50m.geojson is converted to pbf vector tiles with tippecanoe:
tippecanoe --no-feature-limit --no-tile-size-limit --exclude-all --minimum-zoom=1 --maximum-zoom=11 --no-tile-compression -y height -l contours --force --output-to-directory "chamonix_contours_50m" chamonix_contours_50m.geojson
tippecanoe main arguments:
--no-tile-compression: gzip unsupported with serverless direct tiles access.-y height: used instyle.json.-l contours: Name of the contour polylines layer inside the geojson tiles, this name is reused in Maplibrestyle.jsoncontour layers configuration.
You end directly with a plain .pbf directory: chamonix_coutours_50m (use mb-util to generate a .mbtiles).
“Serverless” visualization in Maplibre
Full dataset should look like:

By serverless we mean:
- A web application built using
npm build, then served using only a web server (ie, no GIS server for serving mbtiles such astileserver-glormbtilesserver - A “native” application embedding this web application with it’s own resource/asset system (such as a Qt application with QWebEngine serving data using Qt resources).

Reference:
Create glyph and sprites resources:
Fonts are generated from openmaptiles fonts:
git clone [email protected]:openmaptiles/fonts.git
cd fonts
npm install
node generate.js
Resulting fonts should be copied to public/fonts.
Sprites have not been generated but copied directly from osm-liberty (CC-BY 4.0), the following style.json configuration could be used:
{
  "sprite": "http://localhost:3000/sprites/osm-liberty",
  "glyphs": "http://localhost:3000/fonts/{fontstack}/{range}.pbf",
}
Create a custom style
Our base style is osm-bright (BSD3) from OpenMapTiles.
See public/syle.json
{
  ...
  "sources": {
    "terrain_source": {
			"type":  "raster-dem",
      "tiles": ["http://localhost:3000/chamonix_terrain/{z}/{x}/{y}.png"],
      "minzoom": 0,
      "maxzoom": 12
		},
		"hillshade_source": {
			"type":  "raster-dem",
      "tiles": ["http://localhost:3000/chamonix_terrain/{z}/{x}/{y}.png"],
      "minzoom": 0,
      "maxzoom": 12
		},
    "openmaptiles": {
      "type": "vector",
      "tiles": ["http://localhost:3000/chamonix_osm/{z}/{x}/{y}.pbf"],
      "minzoom": 0,
      "maxzoom": 16,
      "bounds": [6.540000, 45.770000, 7.160000, 46.040000]
    },
    "terrain_contours_50m": {
      "type": "vector",
      "tiles": ["http://localhost:3000/chamonix_contours_50m/{z}/{x}/{y}.pbf"],
      "minzoom": 0,
      "maxzoom": 11
    }
  },
  ...
}
Manually configuring minzoom, maxzoom and bounds is recommended to avoid 404 errors, theses values are easilly extracted from metadata.json file in tiles folder root directory. openmaptiles should not be changed, it is referred in all layers configuration.
Once sources are configured, a special vector layers must be created for contours visualization, this configuration has been adapted from maptiler-terrain-gl-style (BSD3) and merged in “bright”:
  "layers": [
  {
    "id": "contour_index",
    "type": "line",
    "source": "terrain_contours_50m",
    "source-layer": "contours",
    "filter": ["all", ["==", ["%", ["get", "height"], 500], 0]],
    "layout": { "visibility": "visible" },
    "paint": { ... }
  }, ...
  ]
Note that source-layer must be the -l argument used in tippecanoe. Our filter will generate a bold “contour index line” every 500m (ie where height % 500 == 0).
Perspectives
- FIX issue #1 (railways not visible).
- Build a docker image and scripts for data pre-processing.
- Docker deployment with production nginx configuration.
- Docker deployment with an mbtiles server configuration.
Licences
OpenMapTiles is Copyright (c) 2022, MapTiler.com & OpenMapTiles contributors MapLibre GL JS is Copyright (c) 2020, MapLibre contributors