react-smoothie
React wrapper for Smoothie Chart.
Install
npm install react-smoothie --save
Usage
var SmoothieComponent = require('react-smoothie').default;
var TestComponent = React.createClass({
// ...
render: function() {
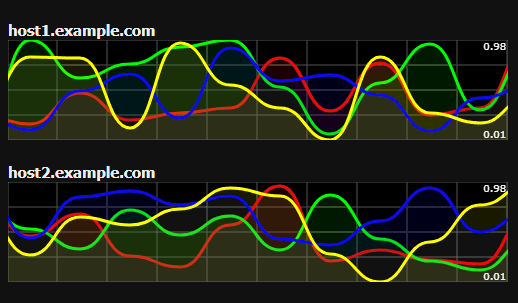
return <SmoothieComponent ref="chart" width="1000" height="300" />;
},
componentDidMount: function() {
var ts1 = this.refs.chart.addTimeSeries({
strokeStyle: 'rgba(0, 255, 0, 1)',
fillStyle: 'rgba(0, 255, 0, 0.2)',
lineWidth: 4,
});
var ts2 = this.refs.chart.addTimeSeries({
strokeStyle: 'rgba(255, 0, 0, 1)',
fillStyle: 'rgba(255, 0, 0, 0.2)',
lineWidth: 4,
});
this.dataGenerator = setInterval(function() {
var time = new Date().getTime();
// Generate times slightly in the future
time += 1000;
ts1.append(time, Math.random());
ts2.append(time, Math.random());
}, 500);
},
componentWillUnmount: function() {
clearInterval(this.dataGenerator);
}
});
Props
SmoothieComponent's props are all passed as the options object to Smoothie Chart's constructor.
<SmoothieComponent ref='chart' width={1000} height={300} interpolation='step' />;
Extra
Three extra props can be used:
width
Control the width of the <canvas> used.
default: 800
height
Control the height of the <canvas> used.
default: 200
streamDelay
default: 0 (ms)
Delay the displayed chart. This value is passed after the component mounts as the second argument to SmoothieChart.streamTo.
Responsive charts
Experimental support for responsive charts was added in 0.3.0.
Simply set the responsive prop to true and canvas will use the full width of the parent container.
Height is still a controlled prop.
TimeSeries
The TimeSeries object from Smoothie Chart is exposed via the addTimeSeries() function.
The optional first argument of addTimeSeries() gets passed as the options to the TimeSeries constructor.
The last argument of addTimeSeries() gets passed as the options argument of SmoothieChart.addTimeSeries().
var ts = this.refs.chart.addTimeSeries({/* Optional TimeSeries opts */},{/* Chart.addTimeSeries opts */})

ts.append(new Date().getTime(), Math.random());
Test
Run yarn dev to start the Webpack Dev Server and open the page on your browser.