![]()
Armada
A light-weight Kubernetes health monitoring tool.
Summary
Armada is an open-source tool for monitoring the health of your Kubernetes cluster. It features a dashboard which delivers an at-a-glance overview of the status of your cluster. It also features a metrics page to view time-series data of your cluster’s performance, and an alerts page and logs page to stay on top of any events that may arise.
Features
Dashboard – Easily Assess and Diagnose Cluster Health
The homepage dashboard provides a comprehensive and easily digestible overview of your cluster health and performance. It shows overall cluster resource usage, cluster statistics, and node and pod statuses. It also features charts tracking the most resource-intensive nodes and pods in your cluster. All data across the application is filterable by namespace.
Metrics – In-Depth View of Cluster Performance
The metrics page displays a curated selection of time-series data regarding your cluster. You can view CPU usage, memory usage, and network data for namespaces, nodes, and pods. Not seeing the information you’re looking for? Simply go to the custom query page and submit your query to see customized time-series charts.

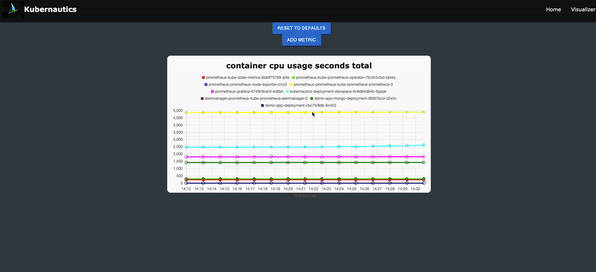
Custom Metrics – Create a Custom View of Your Cluster Metrics
For additional flexibility, the custom metrics page allows users to select from over 800 Prometheus Queries to generate time-series charts with custom inputs for time range, step, and namespace.

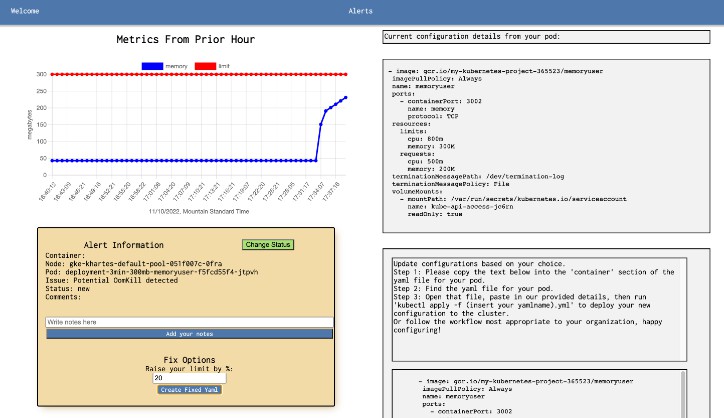
Alerts and Logs – Stay Updated on Cluster Events
The alerts page displays all Prometheus rules, filterable by group, name, status, and severity. Upon expanding a rule you can see any active alerts, along with associated descriptions. You can view event logs on the log page, filterable by type and reason.
Getting Started
1. Prerequisites
Before you start with Armada, make sure you have a configured and running Kubernetes cluster and Prometheus. You can find detailed instructions on how to set this up here.
2. Clone this repo
Run this command in your terminal:
git clone [email protected]:oslabs-beta/Armada.git
3. Install dependencies and start the app
Run these commands from within the root directory:
npm install
npm run build
npm run start
4. Port-forward Prometheus to 9090
To port-forward Prometheus, run the following command, replacing the terms in brackets with the namespace and service name.
kubectl port-forward -n <namespace> svc/<service name> 9090
5. Start using Armada!
Go to http://localhost:3001/ and enjoy your new k8s experience!
Built With
The Team
- Em Podhorcer Github LinkedIn
- Jessica Lee Github LinkedIn
- Natalie Heller Github LinkedIn
- Tori Wu Github LinkedIn