echarts-for-react
A very simple echarts(v3.0 & v4.0) wrapper for react.
1. install
npm install --save echarts-for-react

# `echarts` is the peerDependence of `echarts-for-react`, you can install echarts with your own version.
npm install --save echarts
Then use it.
import ReactEcharts from 'echarts-for-react';

// render echarts option.
<ReactEcharts option={this.getOption()} />
You can run demo by:
git clone [email protected]:hustcc/echarts-for-react.git

npm install

npm start
then open [http://127.0.0.1:8080/](http://127.0.0.1:8080/) in your browser.
2. usage
javascript
import React from 'react';
import ReactEcharts from 'echarts-for-react';  // or var ReactEcharts = require('echarts-for-react');

<ReactEcharts
  option={this.getOption()}
  notMerge={true}
  lazyUpdate={true}
  theme={"theme_name"}
  onChartReady={this.onChartReadyCallback}
  onEvents={EventsDict}
  opts={} />
typescript
import * as React from "react";
import ReactEcharts from "echarts-for-react";

<ReactEcharts
  option={this.getOption()}
  notMerge={true}
  lazyUpdate={true}
  theme={"theme_name"}
  onChartReady={this.onChartReadyCallback}
  onEvents={EventsDict}
  opts={} />
Import ECharts.js modules manually to reduce bundle size
import React from 'react';
// import the core library.
import ReactEchartsCore from 'echarts-for-react/lib/core';

// then import echarts modules those you have used manually.
import echarts from 'echarts/lib/echarts';
// import 'echarts/lib/chart/line';
import 'echarts/lib/chart/bar';
// import 'echarts/lib/chart/pie';
// import 'echarts/lib/chart/scatter';
// import 'echarts/lib/chart/radar';

// import 'echarts/lib/chart/map';
// import 'echarts/lib/chart/treemap';
// import 'echarts/lib/chart/graph';
// import 'echarts/lib/chart/gauge';
// import 'echarts/lib/chart/funnel';
// import 'echarts/lib/chart/parallel';
// import 'echarts/lib/chart/sankey';
// import 'echarts/lib/chart/boxplot';
// import 'echarts/lib/chart/candlestick';
// import 'echarts/lib/chart/effectScatter';
// import 'echarts/lib/chart/lines';
// import 'echarts/lib/chart/heatmap';

// import 'echarts/lib/component/graphic';
// import 'echarts/lib/component/grid';
// import 'echarts/lib/component/legend';
import 'echarts/lib/component/tooltip';
// import 'echarts/lib/component/polar';
// import 'echarts/lib/component/geo';
// import 'echarts/lib/component/parallel';
// import 'echarts/lib/component/singleAxis';
// import 'echarts/lib/component/brush';

import 'echarts/lib/component/title';

// import 'echarts/lib/component/dataZoom';
// import 'echarts/lib/component/visualMap';

// import 'echarts/lib/component/markPoint';
// import 'echarts/lib/component/markLine';
// import 'echarts/lib/component/markArea';

// import 'echarts/lib/component/timeline';
// import 'echarts/lib/component/toolbox';

// import 'zrender/lib/vml/vml';

// The usage of ReactEchartsCore are same with above.
<ReactEchartsCore
  echarts={echarts}
  option={this.getOption()}
  notMerge={true}
  lazyUpdate={true}
  theme={"theme_name"}
  onChartReady={this.onChartReadyCallback}
  onEvents={EventsDict}
  opts={} />
3. component props
option(required, object)
the echarts option config, can see http://echarts.baidu.com/option.html#title.
notMerge(optional, object)
when setOption, not merge the data, default is false. See http://echarts.baidu.com/api.html#echartsInstance.setOption.
lazyUpdate(optional, object)
when setOption, lazy update the data, default is false. See http://echarts.baidu.com/api.html#echartsInstance.setOption.
style(optional, object)
the style of echarts div. object, default is {height: '300px'}.
className(optional, string)
the class of echarts div. you can setting the css style of charts by class name.
theme(optional, string)
the theme of echarts. string, should registerTheme before use it (theme object format: https://github.com/ecomfe/echarts/blob/master/theme/dark.js). e.g.
// import echarts
import echarts from 'echarts';
...
// register theme object
echarts.registerTheme('my_theme', {
  backgroundColor: '#f4cccc'
});
...
// render the echarts use option `theme`
<ReactEcharts
  option={this.getOption()}
  style={{height: '300px', width: '100%'}}
  className='echarts-for-echarts'
  theme='my_theme' />
onChartReady(optional, function)
when the chart is ready, will callback the function with the echarts object as it's paramter.
loadingOption(optional, object)
the echarts loading option config, can see http://echarts.baidu.com/api.html#echartsInstance.showLoading.
showLoading(optional, bool, default: false)
bool, when the chart is rendering, show the loading mask.
onEvents(optional, array(string=>function) )
binding the echarts event, will callback with the echarts event object, and the echart object as it's paramters. e.g:
let onEvents = {
  'click': this.onChartClick,
  'legendselectchanged': this.onChartLegendselectchanged
}
...
<ReactEcharts
  option={this.getOption()}
  style={{height: '300px', width: '100%'}}
  onEvents={onEvents} />
for more event key name, see: http://echarts.baidu.com/api.html#events
opts(optional, object)
the opts of echarts. object, will be used when initial echarts instance by echarts.init. Document here.
<ReactEcharts
  option={this.getOption()}
  style={{height: '300px'}}
  opts={{renderer: 'svg'}} // use svg to render the chart.
/>
4. Component API & Echarts API
the Component only has one API named getEchartsInstance.
getEchartsInstance(): get the echarts instance object, then you can use anyAPI of echarts.
for example:
// render the echarts component below with rel
<ReactEcharts ref={(e) => { this.echarts_react = e; }}
  option={this.getOption()} />

// then get the `ReactEcharts` use this.echarts_react

let echarts_instance = this.echarts_react.getEchartsInstance();
// then you can use any API of echarts.
let base64 = echarts_instance.getDataURL();
About API of echarts, can see http://echarts.baidu.com/api.html#echartsInstance.
You can use the API to do:
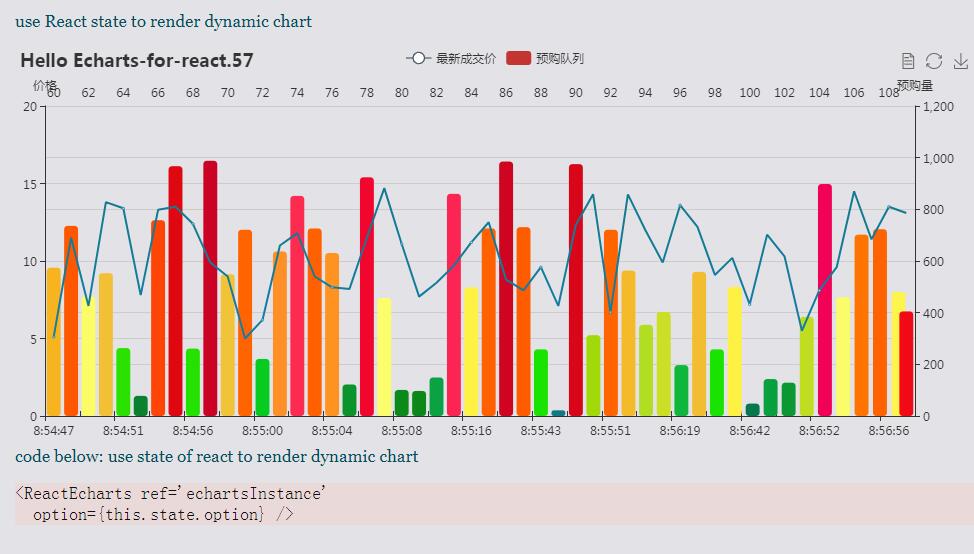
binding / unbindingevent.dynamic chartswith dynamic data.- get the echarts dom / dataURL / base64, save the chart to png.
releasethe charts.
5. Q & A
- How to render the chart with svg when using echarts 4.x
Use the props opts of component with renderer = 'svg'. For example:
<ReactEcharts
  option={this.getOption()}
  style={{height: '300px'}}
  opts={{renderer: 'svg'}} // use svg to render the chart.
/>