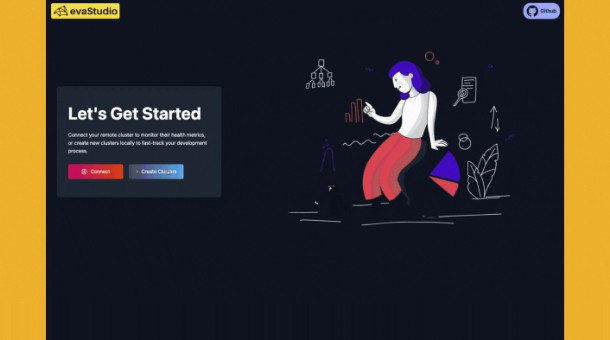


Design and scale a real-time streaming data pipeline at the click of a button.
evaStudio (beta) is a web GUI and testing playground for quickly designing and scaling your event-driven data architecture with Kafka brokers and Zookeeper. Designed with data scientists in mind, EvaStudio makes it easier to develop, orchestrate, experiment, and monitor machine learning workflows at scale, so you can focus on analytical challenges instead of infrastructure.
Getting Started
To install our web application locally, you will need Docker, Node Package Manager, Java JDK 11 and Maven. Clone this repository, and run npm install at the root of the directory. Then run mvn spring-boot:run to start the “java_backend” microservice.
Features
- Design your pipeline using a drag-and-drop tool for extracting, transforming, and loading data in and out of Kafka messaging brokers.
- Source streaming data from a CSV, SQL database, or HTTP/API, to Apache Spark or Jupyter Notebook for analysis.
- Manage topics and messages directly inside our web GUI.
- Monitor cluster health, and check performance metrics for load, latency, throughput, disk usage, and messages and bytes in and out per second, in order to test and scale your data architecture before loading into production.
You can also connect your existing Kafka clusters on AWS, provided that you follow our setup instructions in our documentation for Prometheus, JMX, and Grafana installation.
Interface
1. Drag-and-drop data pipeline designer

2. Stream data via HTTP / API or by uploading a CSV to run through Kafka clusters

3. Monitor cluster health. Manage brokers, topics, partitions, and messages.

4. Monitor system metrics: fetch response latency, throughput (messages & bytes per second), CPU and JVM usage, Zookeeper failures.

Application Architecture and Logic
evaStudio is a browser-based application built using ReactJs and Node/Express, with a Java Spring Boot microservice to interface with Kafka servers and Zookeeper. In our beta version, we are exposing data endpoints on Kafka clusters using Prometheus and JMX, and displaying analytics with Grafana. In iteration, we plan to make loading and real-time updating of these panels faster using D3. We use React Flow for a drag-and-drop GUI for sketching out a data pipeline. We connect data sources and sinks to a user-selected number of Kafka servers locally, to be spun up with Docker.
Currently, we allow for data to be imported as a CSV and “mock-streamed” for real-time analytics. We also connect to the PostgreSQL database, and allow for data to be streamed from an HTTP or API endpoint. We provide the option of Jupyter Hub or Spark for analytics. Future iterations will allow for more data transformations, mapping/reducing/filtering, and connections to more microservices through the GUI tool that enable easier deployment of machine learning models and applications. We will also be making our application available on DockerHub.
Built With
- Apache Kafka v3.2.0
- Spring for Apache Kafka v2.8.9
- Java Spring Boot v2.6.9 with Spring Web Services v3.1.1
- Apache Maven v3.8.6 requiring Java SE Development Kit v11.0.16
- ReactJS v17
- Redux 4.1
- React Router 6.3
- React Flow 10.3.8
- NodeJS with Express v4.16
- Typescript 4.7
- Tailwind.css v3.1
- PostgreSQL v14
- Docker 20.10
- Prometheus & JMX Exporter v0.17.0
- Grafana v9.0
- Material UI v5.9 & v5.8
- JUnit, Embedded Kafka & Mockito for unit & integration testing
- Amazon Web Services & Github Actions for CI/CD
DOCUMENTATION:
- Next.js with Vercel
Core Team

Andres Chaparro |

Kaitlin Zhang |

Maxwell Shick |

Perla Royer |

Sattwik Biswal |
With Special Thanks To:
Our advisors Mia Zeng and Brandon McKallagat