react-vis
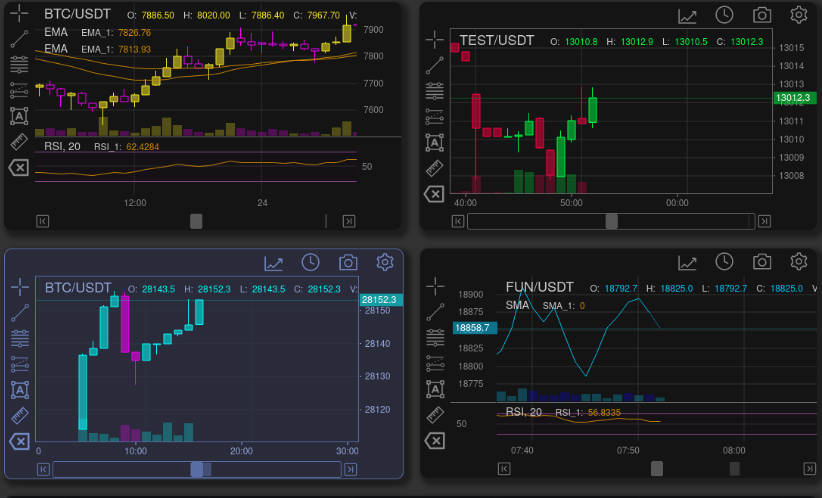
A collection of react components to render common data visualization charts, such as line/area/bar charts, heat maps, scatterplots, contour plots, pie and donut charts, sunbursts, radar charts, and tree maps.
Some notable features:
- Simplicity. react-vis doesn't require any deep knowledge of data visualization libraries to start building your first visualizations.
- Flexibility. react-vis provides a set of basic building blocks for different charts. For
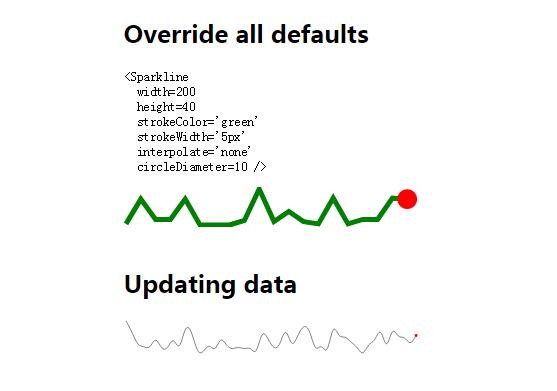
instance, separate X and Y axis components. This provides a high level of control of chart layout for applications that need it. - Ease of use. The library provides a set of defaults which can be overridden by the custom user's settings.
- Integration with React. react-vis supports the React's lifecycle and doesn't create unnecessary nodes.
Live Demo
http://uber.github.io/react-vis/