react-svg-worldmap
A simple, compact and free React SVG world map.
import { WorldMap } from "react-svg-worldmap"
...
const data =
    [
      { country: "cn", value: 1389618778 }, // china
      { country: "in", value: 1311559204 }, // india
    ]
...
<WorldMap color="green" title="This is My Map" size="lg" data={data} />
Why is it different?
Focus on simple and free.
- Draw countries on a world map.
- Free - Really free with no limits.
- No registration - It is just a pure react component.
- No internet dependency - All the data is local, no calls to a back-end server.
- Easy to learn, easy to use, easy to customize.
Yet another package for world map...but why?
It all started with a fun project that I was building and needed to draw simple yet beautiful world's map. Searching for solutions I found many potential solutions like MapBox and Google Maps, but they were "too smart" for what I needed. They needed to "call home" for the data, they supported tons of options I didn't need, and while they included react-integrations, they were not completely native to the react world. There was definitely something missing. And that's when react-svg-worldmap started.
Install
In order to install, run the following command:
$ npm install react-svg-worldmap --save
Usage
Explore the example folder for a simple case for an end-to-end react app using the react-svg-worldmap.
Here is a simple example:
import React from "react"
import "./App.css"
import { WorldMap } from "react-svg-worldmap"
function App() {
const data =
[
{ country: "cn", value: 1389618778 }, // china
{ country: "in", value: 1311559204 }, // india
{ country: "us", value: 331883986 }, // united states
{ country: "id", value: 264935824 }, // indonesia
{ country: "pk", value: 210797836 }, // pakistan
{ country: "br", value: 210301591 }, // brazil
{ country: "ng", value: 208679114 }, // nigeria
{ country: "bd", value: 161062905 }, // bangladesh
{ country: "ru", value: 141944641 }, // russia
{ country: "mx", value: 127318112 } // mexico
]
return (
<div className="App" >
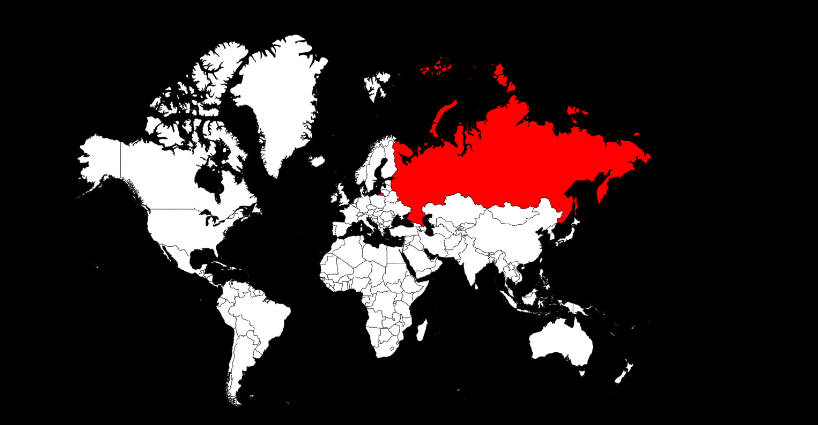
<WorldMap color="red" title="Top 10 Populous Countries" value-suffix="people" size="lg" data={data} />
</div>
)
}
Customization
Data
The only mandatory prop. Data contains an array of country/value objects, with values for countries that you have values for, (countries without a value will be blank). The country code is a 2 character string representing the country ([ISO alpha-2] (https://en.wikipedia.org/wiki/ISO_3166-1_alpha-2)) and value is a number.
Example of valid data prop:
  const data =
    [
      { country: "cn", value: 1 }, // china
      { country: "in", value: 2 }, // india
      { country: "us", value: 3 }  // united states
    ]
Custom Styling
This is an optional more advanced customization option. When used, the developer has full control to define the color, opacity and any other style element of a country with data record.
This is done by passing your custom implementation of the styleFunction. The function recieves as input the country context that includes country,countryValue: colorm, minValue and maxValue, and returns a json object representing the style.
For example:
const stylingFunction = (context : any) => {
    const opacityLevel = 0.1 + (1.5 * (context.countryValue - context.minValue) / (context.maxValue - context.minValue))
    return {
        fill: context.country === "US" ? "blue" : context.color,
        fillOpacity: opacityLevel,
        stroke: "green",
        strokeWidth: 1,
        strokeOpacity: 0.2,
        cursor: "pointer"
           }
}
On Click Action
This is an optional more advanced customization option. When used, the developer has full access to the click event, country name, iso code, value, prefix and suffix is given.
This is done by passing your custom implementation of the onClickFunction. The function takes in the following parameters:
1. event: React.MouseEvent<SVGElement, MouseEvent>
2. countryName: string
3. isoCode: string
4. value: string
5. prefix?: string
6. suffix?: string
For example:
const clickAction = (event: React.MouseEvent<SVGElement, MouseEvent>, countryName: string, isoCode: string, value: string, prefix?: string, suffix?: string) => {
    //Your action on click that you want to perform see example in the examples folder called onclick-example
}
Optional Props
| Prop | Type | Description |
|---|---|---|
| data | Array | Mandatory. Array of JSON records, each with country/value. |
| size | string | The size of your map, either "sm", md", or "lg" |
| title | string | Any string for the title of your map |
| color | string | Color for highlighted countries. A standard color string. E.g. "red" or "#ff0000" |
| tooltipBgColor | string | Tooltip background color |
| tooltipTextColor | string | Tooltip text color |
| valuePrefix | string | A string to prefix values in tooltips. E.g. "$" |
| valueSuffix | string | A string to suffix values in tooltips. E.g. "USD" |
| backgroundColor | string | Component background color |
| strokeOpacity | string | The stroke opacity of non selected countries |
| frame | boolean | true/false for drawing a frame around the map |
| frameColor | string | Frame color |
| borderColor | string | Border color around each individual country. "black" by default |
| type | string | Select type of map you want, either "tooltip" or "marker" |
| styleFunction | (context: any) => {} | A callback function to customize styling of each country (see custom-style-example) |
| tooltipTextFunction | (countryName: string, isoCode: string, value: string, prefix?: string, suffix?: string) => {} | A callback function to customize tooltip text (see localization-example) |
Samples
examples/simple-example
- A simple example of the world map
- 4 maps given two different data sets
- Example of some simple features using the default styling
examples/custom-style-example
- An example of a custom styling function
- Context type must remain any so that you can use the inputs that I pass to you
The inputs are as follows:
| Input | Type | Description |
|---|---|---|
| country | string | ISO value for each country |
| countryValue | number | Value inputted for the specific country (this is the input data for the specific country) |
| color | string | The color that is inputted by the user for countries with values |
| minValue | number | The smallest value of the input data |
| maxValue | number | The largest value of the input data |
examples/localization-example
- An example showing how to use the tooltipTextFunction to locolize tooltip texts.
- The function translates both country names and values to spanish.
- For example:
| Data | Localized text |
|---|---|
{ "country": "us", value: 331883986 } |
"Estados Unidos: 3.32 mil millónes" |