![]()
KafOpticon
Kafka Cluster Monitor and Visualizer
Built With
About the Project
What: KafOpticon is an open-source electron app used for monitoring, visualizing, and alerting users of Kafka cluster/server metrics. Kafka is a powerful open-source data stream processing software platform. KafOpticon article can be found here.
Why: Monitoring relevant cluster metrics is challenging due to the volume
and accessibility of the metrics. KafOpticon aims to solve these problems by
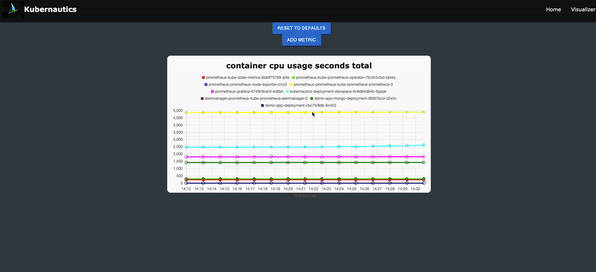
providing REAL-TIME monitoring, visualization, and alert features.
![]()
Submit JMX Port Numbers ![]()
Customize your own dashboard with user-selected metrics for more granular
control. ![]()
Customize Automatic Email Alerts
![]()
Dependencies: Grafana and Prometheus
Installation
To install as an app, navigate to the releases page of our repository, find the file that matches your OS, and download it.
Additionally, you could clone this repository, run npm install and then
npm start to run the app from source code.
It is also possible to clone the repository, checkout into the electron-builder
branch that matches your OS, and execute npm run dist. The app will be in the
out/ folder at the repository’s root.
Using KafOpticon with Docker-mediated Prometheus and Grafana
KafOpticon is specially designed for ease of monitoring Kafka clusters. It automatically generates Prometheus and Grafana containers in Docker, which connect to the metrics endpoints you provide. This setup uses JMX Exporter’s JMX-Prometheus Java Agent to scrape metric endpoints from each Kafka cluster.
Configuration Steps:
-
Set Up Your Kafka Cluster for Monitoring:
- For configuring your own Kafka cluster to be monitored using KafOpticon, ensure that your Kafka cluster exposes Prometheus-readable metrics data. This is crucial for KafOpticon’s Prometheus container to connect effectively.
- For more information on setting up JMX Exporter, visit the JMX Exporter GitHub page.
-
Connect KafOpticon to Your Cluster:
- Open the KafOpticon app.
- Provide a comma-separated list of the exposed JMX Endpoints of your Kafka cluster (e.g. 9991, 9992, 9993).
- Click on the “send to Docker monitoring” checkbox and hit send.
Monitoring with Docker Desktop:
- After setting up, monitor the process in Docker Desktop. Prometheus and Grafana containers will be built for monitoring your cluster.
- Allow KafOpticon some time to refresh as these containers are built and monitoring information is sent to the app.
- If the dashboard is not displaying as expected, press
Command+R(orCtrl+Ron Windows) to refresh the page. - Regularly check Docker Desktop to ensure the Prometheus and Grafana containers are running as expected. Restart any containers that have exited to troubleshoot potential issues.
Run Docker Test
If you want to test the app, but you don’t have your own Kafka cluster, follow the directions below.
-
Preconditions:
- Docker Desktop must be installed and the Docker daemon must be running.
- Ports 3000, 3010, 9090, 9991, 9992, and 9993 must be available.
-
Run Kafka Test Cluster in Docker:
- Navigate to the
docker-testdirectory and rundocker-compose up -dto start a Kafka cluster in Docker with three brokers, each exposing metrics on ports 9991, 9992,and 9993, respectively. Ensure the container is running without issues in Docker Desktop. Restart any exited containers if necessary.
docker-compose up -d
- Navigate to the
-
Run Electron:
- Run electron with
npm startin the root directory.
npm start
- Start Monitoring:
- Provide a comma-separated list of the exposed JMX Endpoints of your Kafka
cluster (9991, 9992, 9993 if using the provided docker-compose file), check
the “send to Docker monitoring checkbox”, and hit send. Monitor the setup in
Docker Desktop and refresh the app as needed using
COMMAND+R.
- Stop Docker Test:
- Stop the prometheus and grafana containers, and run
docker-compose downwithin the docker-test directory.
docker-compose down
Run local test
-
Preconditions:
- Prometheus and Grafana must be installed
- Ensure that Prometheus and Kafka are in your
$PATH - Grafana must be running already (on port 3000) and must be configured to allow anonymous access with the admin role in the Main Org.
- Ports 3010, 9090, 3030, and 9092 must be available
-
Open up two terminals in the root directory.
-
Run
npm run bootZooandnpm run bootKaf1in the separate terminals.
npm run bootZoo
npm run bootKaf1
- Open up a terminal in the root directory. Run
npm startin the root directory
npm start
- In the electron app, type ‘2020’ into the form, check ‘send to local monitoring’ and submit it. Wait. Refresh if necessary. Click into performance or health metrics. Data on the kafka cluster should be displayed.
Customization
KafOpticon offers flexible customization options for both locally mediated and Docker-mediated testing environments.
Customizing Monitoring Dashboard:
- Pre-configured Panels: You can configure an additional monitoring tab with up to 10 panels of pre-selected metrics.
- Grafana Dashboard Customization:
- Navigate to
localhost:3000in your browser. - Click into
Dashboards, and locate a dashboard titled KafOpticon Dashboard. - Use the features of Grafana to customize your dashboard to your preference.
- Navigate to
Making Customizations Persistent:
-
Saving Changes in Grafana:
- After making your desired changes, save them within Grafana.
- Export the dashboard JSON that Grafana provides.
-
Updating the Source Code:
- If you are running KafOpticon from the source code, navigate to
grafana/Dockerfile/provisioning/dashboards. - Replace the existing
dashboard.jsonwith your new one and save the changes. - Currently, this will only work if you choose to use KafOpticon’s Docker route to monitor your clusters.
- If you are running KafOpticon from the source code, navigate to
By following these steps, you can tailor the KafOpticon monitoring experience to better suit your specific needs and preferences.
Alerts
In order to enable automatic alerts an email and app password are required. The easiest way to do this is to provide a gmail username and an app password in the relevant fields of the alerts dashboard. After clicking the submit button, you must restart Grafana for the changes to take place. After Grafana has been restarted, you are now free to add any emails you want to receive the alerts in the Grafana alerts contact points. You can send test email using the test button. Configure and customize threshholds for the alerts within Grafana. Congratulations! ?️ You should now be able to receive automatic email alerts about your Kafka clusters.
Road Map
| Feature | Status |
|---|---|
| Visualize Kafka Cluster | ✅ |
| User Customized Dashboard | ⏳ |
| Testing | ⏳ |
| Windows Distribution | ⏳ |
| Enhance Security | ?? |
| Enable Connecting to Remote Cluster | ?? |
- ✅ = Ready to use
- ⏳ = In progress
- ?? = Looking for contributors
Bugs
Please report bugs to the issues tab.
Contributing
Contributions are what make the open source community a great place! If you would like to contribute to this project take the steps below:
- Fork the Project
- Create a Feature Branch Use
git checkout -b newFeature
git checkout -b newFeature
- Commit your Changes Use
git commit -m newFeature
git commit -m newFeature
- Push to the Branch Use
git push origin newFeature
git push origin newFeature
- Open a Pull Request
Contributors
https://github.com/anewatech https://github.com/GOsorioCanales https://github.com/kelaompachai https://github.com/zackweiss


